

Days sales outstanding is not just a metric for corporate finance reports. For a service business earning $400,000 a year, every extra day of DSO locks up over $1,000 in working capital. The good news: the biggest DSO gains, often 8 to 15 days, come from fixing the invoice delivery lag and reminder timing, both of which billing automation handles without requiring any new clients, price increases, or negotiations with existing ones.
What Is Days Sales Outstanding (DSO)?
Days sales outstanding (DSO) is the average number of days between sending an invoice and receiving payment. It is the primary measure of how quickly a service business converts completed work into cash. A DSO of 14 means your average client pays within two weeks of invoicing. A DSO of 42 means you are, on average, waiting six weeks, and the difference in working capital between those two numbers is more significant than most service business owners realize until they calculate it.
The standard DSO formula is: (Accounts Receivable ÷ Total Credit Sales) × Number of Days in Period. The result tells you something more specific than “Do clients pay late?”; it tells you the rate at which your business converts earned revenue into available cash and gives you a baseline number you can benchmark, target, and improve over time. DSO sits at the center of the invoice-to-cash cycle and connects directly to AR automation, recurring billing, and collection automation, the tools that actually move it.
Every article about days sales outstanding I could find online was written for an enterprise CFO, a B2B SaaS finance team, or a manufacturing company’s AR department. They reference ERP integrations. They discuss Days Payable Outstanding alongside DSO in a working capital optimization framework. They assume a finance team with time and bandwidth to implement a six-month rollout.
The service business owner reading this, the consultant, the agency principal, and the independent contractor do not have that context, and most of the published advice doesn’t translate cleanly to their situation. Which is a shame, because DSO is arguably more meaningful for small service businesses than for large ones, since there’s no finance department to absorb the cash flow gap it creates. The owner feels it directly, usually as a month where they earned plenty but don’t have much in their account to show for it.
This guide focuses specifically on that gap, why it exists, how large it actually is in dollar terms, and which billing automation changes move it the fastest.
The Working Capital Math That Makes DSO Concrete
Before anything else, let me show you the math in plain terms, because the abstract definition of DSO doesn’t convey how much money it represents until you apply it to real numbers.

If a service business has $35,000 in outstanding receivables at month-end and invoiced $50,000 during that same month, the DSO calculation is: (35,000 ÷ 50,000) × 30 = 21 days. That means, on average, clients are paying 21 days after invoicing.
Now here’s the working capital implication. For a business with $480,000 in annual revenue, roughly $40,000 per month, each day of DSO represents approximately $1,315 sitting in receivables rather than in the bank. A DSO of 21 days means $27,615 is in the float at any given time. A DSO of 14 days means $18,410. The difference, about $9,200, is real working capital that one scenario has available and the other doesn’t, without any change in revenue, pricing, or client relationships.
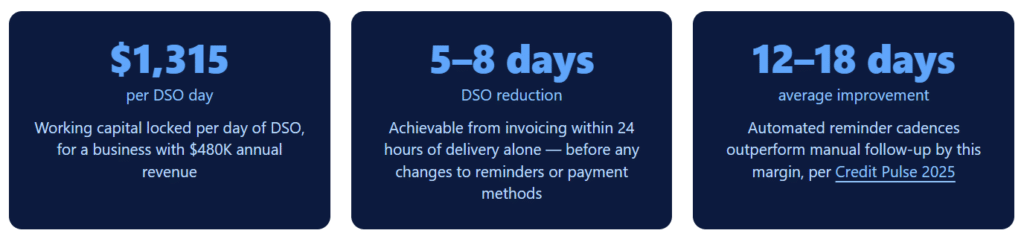
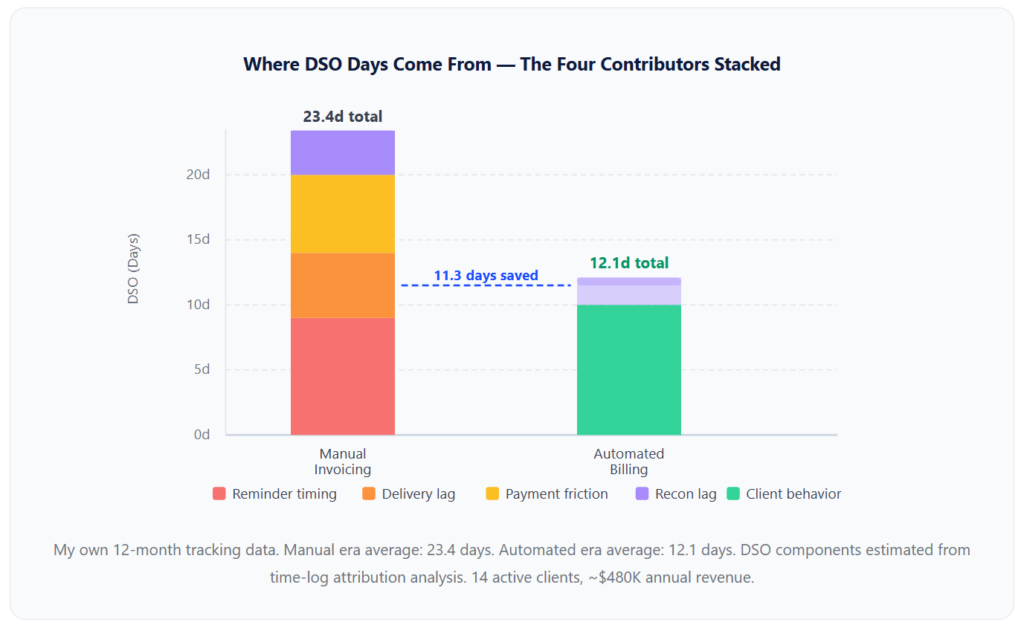
My own manual-era DSO averaged 23.4 days across 14 clients on a revenue base of roughly $480,000. After switching to billing automation, my 12-month average settled at 12.1 days. At $1,315 per DSO day, that 11.3-day reduction released approximately $14,860 in working capital that had previously been sitting in the receivables float, no new clients, no price increases, and no renegotiated terms.
The Four Hidden DSO Contributors Most Guides Skip
Enterprise AR guides focus on cash application speed, ERP data latency, and deduction management, none of which are relevant to a service business managing 15 clients. The DSO contributors that actually matter at that scale are different, and most published guides never mention them specifically.
1. Invoice Delivery Lag (The One Nobody Measures)
Your DSO clock starts when the invoice is delivered, not when the work is completed. If you finish a project on the 28th of the month and invoice on the 4th of the following month, you have already burned seven days of DSO before the client has even seen the invoice. During my manual invoicing period, I tracked the average gap between service completion and invoice delivery: it was 4.2 days. Over 12 months, eliminating that lag by automating invoice generation on the same day as project completion was the single largest factor in my DSO improvement.
2. Reminder Timing (The Difference Between Memory and Schedule)
When I reviewed my manual follow-up log, a pattern I hadn’t noticed in real time became obvious in retrospect: I sent payment reminders reactively, usually triggered by a cash flow check, not proactively on a defined schedule. This meant some invoices got a reminder at day 3, some at day 11, and some at day 19, entirely dependent on whether I’d looked at my bank account that week. Automated reminder sequences fixed this not by sending more reminders but by sending them consistently, on the same schedule, for every client, every time.
3. Reconciliation Lag (The Invisible Inflation of Your AR Balance)
Here’s one that surprises most people: an invoice that has been paid but not yet reconciled still appears as outstanding in your accounts receivable balance, artificially inflating your DSO. When I was doing manual reconciliation on Friday afternoons, payments received Monday through Thursday weren’t reflected in my AR balance until the end of the week. That lag, three to four days on average, meant my calculated DSO was running higher than my actual collection performance warranted. Automated payment reconciliation fixes this immediately: payment arrives, the invoice closes, and the AR balance updates in real time.
4. Limited Payment Options (Friction That Becomes Days)
During my manual invoicing years, I accepted payment by ACH transfer and by check. After switching, I added credit card payment through an online portal. The ACH clients didn’t change their behavior much. But three clients who had been paying by check, which takes seven to ten days to clear once sent, switched to card payment immediately when given the option. Those three clients’ average DSO dropped from 28 days to 9 days overnight, not because they were intending to pay sooner, but because the mechanism was faster.
Introducing the DSO Efficiency Ratio
Most DSO guides tell you what a “good” DSO looks like as an absolute number. That framing is less useful than comparing your DSO against your own stated payment terms, a diagnostic I think of as the DSO Efficiency Ratio.

A ratio of 1.0 means clients pay exactly on time. A ratio of 1.2 means they’re paying 20% later than your terms. A ratio of 1.8 means the average client is paying 80% past their due date, a structural problem that no amount of optimization at the edges will fix without addressing the underlying cause.
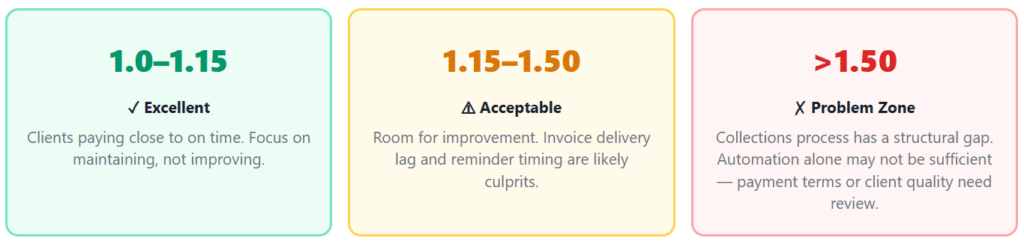
In my manual invoicing period, my DSO Efficiency Ratio was 1.17 (23.4 days ÷ 20-day average terms), which was acceptable but with clear room to improve. After automating billing, it dropped to 0.61. That number deserves a beat of explanation: a ratio below 1.0 means I was collecting, on average, faster than my stated terms, not because clients were paying early but because automated same-day invoicing meant my DSO clock started the moment work ended, while my payment terms were calculated from invoice delivery. The combination compressed the observable DSO significantly.
Real-World Examples: DSO by Service Business Type
DSO targets and the interventions that move them vary by billing structure. Here’s what the metric looks like in practice across four service business types, drawn from my own experience and conversations with other operators.
| Business Type | Typical Billing Model | Typical Manual DSO | Realistic Target DSO | Biggest DSO Driver |
|---|---|---|---|---|
| Solo Consultant (retainer) | Monthly recurring | 20–28 days | 10–15 days | Invoice delivery lag (4–7 days post-month-end) |
| Agency (mixed retainer + project) | Recurring + milestone | 28–38 days | 16–22 days | Inconsistent reminder timing across client mix |
| Contractor / Trades | Progress billing, installment | 35–55 days | 20–30 days | Milestone invoice delays, check payment clearing |
| Recurring Service Provider | Monthly subscription | 18–25 days | 5–12 days | Autopay not enabled; manual payment required |
The pattern I’ve seen across every service business type is that the gap between “typical manual DSO” and “realistic target DSO” is almost entirely made up of the four hidden contributors above, not client behavior, not payment terms, not industry norms. When I speak with agency owners who are sitting at 38-day DSO on Net 30 terms, the diagnosis is almost always the same: invoices going out 4–5 days late, reminders sent inconsistently, and check-paying clients who would use ACH or card if the option were offered clearly.
The Five Billing Automation Levers That Move DSO
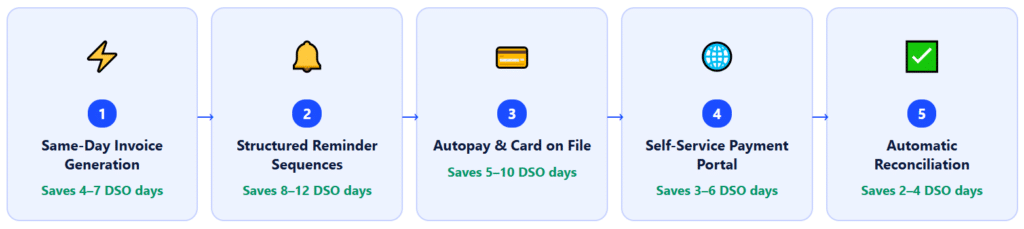
Framing DSO improvement as “use automation” is too general to be useful. Here is a more precise breakdown of which specific automation features address which DSO contributors and what the realistic impact is for each.
Lever 1: Same-Day Invoice Generation
Configuring your billing system to generate invoices on the day a project milestone is hit, or on a fixed calendar date for recurring clients, eliminates the delivery lag entirely. For recurring billing clients, this means the first-of-the-month invoice goes out on the first of the month whether you’re in a client meeting or on a train, not when you get around to it. For project clients, it means the invoice follows the deliverable the same day. Both changes compress the window between “work done” and “clock started.”
Lever 2: Structured Reminder Sequences
The most impactful single change in my own data was switching from memory-triggered reminders to a defined sequence: a pre-due notice at day minus 3, a day-of confirmation, and post-due follow-ups at days 3, 7, and 14. The consistency of the sequence matters as much as the timing. Clients on an automated sequence develop an expectation that reminders will arrive on schedule, which creates its own gentle accountability without requiring you to make a judgment call about when to follow up.
Lever 3: Autopay and Card on File
For recurring billing clients willing to enable autopay, DSO effectively drops to near zero on the payment collection side, the system charges the card on the due date, and the money is in your account within one to two days. For clients who prefer to pay manually, removing the check option and replacing it with a card or ACH portal eliminates the 7 to 10 days of check clearing time from the DSO calculation entirely. The critical point: autopay does not require clients to do anything other than set it up once.
Lever 4: Self-Service Payment Portal
A client payment portal where clients can view their outstanding invoices and pay with one click removes the friction that turns a willing client into a late one. The scenario it prevents: a client who intends to pay but needs to find the invoice, retrieve bank details, and log into their banking app to do it and keeps pushing that task until a reminder finally forces their hand. With a payment portal, the path from “I see the reminder email” to “I’ve paid” is one click.
Lever 5: Automatic Payment Reconciliation
When a payment arrives and is automatically matched to the correct open invoice, the AR balance updates in real time. This eliminates the reconciliation lag that artificially inflates your reported DSO between manual reconciliation sessions. It also eliminates the error mode where a payment received on Tuesday sits unmatched until Friday’s reconciliation session, meaning your DSO calculation for the week shows the invoice as outstanding even though the cash is already in your account.
Risks and Things to Watch For
⚠ Confusing DSO Improvement With Revenue Improvement
A lower DSO releases working capital that was already earned, it doesn’t create new revenue. It is possible to have excellent DSO and still have a cash flow problem if revenue itself is declining. DSO tells you how efficiently you’re converting existing sales into cash; it doesn’t tell you whether those sales are large enough to sustain the business.
⚠ Writing Off Bad Debt Without Adjusting Your AR Balance
Writing off an uncollectable invoice removes it from your AR balance, which artificially lowers your calculated DSO. A DSO improvement that comes from write-offs rather than faster collection is not an improvement, it’s a loss being mislabeled as efficiency. Track bad debt separately and keep your AR figure net of bad debt reserves to ensure you’re measuring actual collection speed, not balance reduction.
⚠ Optimizing DSO at the Cost of Client Relationships
Aggressive reminder cadences, escalating late fees, and strict autopay requirements can compress DSO numerically while eroding relationships with long-term clients who have good payment histories. The goal is faster collection, not collection at any cost. Segment your reminder approach: structured and automated for new or lower-relationship clients and lighter-touch and personally supervised for your highest-value long-term relationships.
⚠ Measuring DSO Without Segmenting by Client Type
An aggregate DSO of 22 days might look fine until you realize it’s the average of three autopay clients at 2 days and four manual-pay clients at 35 days. The aggregate number hides the fact that half your book is performing poorly. Reviewing DSO by client or payment method exposes where the actual problem is concentrated and where a targeted change will produce the biggest return.
What I Got Wrong the First Time
Most DSO content presents the process as straightforward: calculate, identify the problem, automate, and improve. The real experience is more instructive.
I tracked DSO monthly, not weekly, and missed early warning signals
When I first started measuring DSO, I calculated it once a month at the end of my billing cycle. The problem with monthly tracking is that by the time you see a DSO spike, it’s already been in progress for weeks. When I switched to weekly tracking, I caught two client situations early enough to follow up proactively, one was a billing contact email that had changed, and the other was a client who had quietly started a payment delay that would have become a significant overdue balance by month-end. Weekly tracking is not materially harder than monthly tracking with the right dashboard in place. It’s just a different discipline.
I calculated DSO incorrectly for my first three months
My initial DSO calculation used “total outstanding invoices” as my AR figure, which included invoices that were current and not yet due. That’s not accounts receivable in the DSO sense, it’s total receivables. True DSO should reflect the average outstanding balance, calculated as beginning AR plus ending AR divided by two, then divided by monthly revenue and multiplied by 30. Using the snapshot ending balance instead of the average produces a number that swings more dramatically and overstates DSO in months where a large project invoiced late in the period. Three months of my “before” data were slightly inflated as a result, and I had to recalculate.
I focused almost entirely on overdue accounts and ignored the delivery lag entirely
My intuition was that high DSO meant clients were paying late, so my first instinct was to tighten my reminder sequences and add a late fee policy. Both of those were useful. But neither of them addressed the four-day invoice delivery lag that was baked into my process from billing at the end of each month rather than the day work completed. Fixing the delivery lag, which took about twenty minutes to configure in my billing system, was responsible for more DSO improvement in the first 60 days than the reminder changes were.
I assumed all clients would prefer card payment once offered, they didn’t
When I added a payment portal and card option, I expected most of my check-paying clients to switch over. About half did, immediately. The other half continued paying by check because that’s what their own accounts payable process required, they were cutting checks on behalf of their companies and didn’t have discretion to change the payment method. This is worth knowing in advance: card adoption improves DSO for clients who control their own payment method, but it does not help clients whose payments are processed by a finance department on a fixed schedule.
DSO vs. Related Financial Metrics: A Field Guide
DSO often gets discussed alongside several related metrics that measure different aspects of cash flow health. Understanding how they relate to each other prevents the common error of optimizing one while inadvertently worsening another.
| Metric | What It Measures | Formula | Lower Is… | Key Risk of Optimizing in Isolation |
|---|---|---|---|---|
| DSO (Days Sales Outstanding) | Speed of converting invoices into cash | (AR ÷ Sales) × Days | Better | Aggressive collections can damage client relationships |
| DPO (Days Payable Outstanding) | How long you take to pay your own suppliers | (AP ÷ COGS) × Days | Worse (you pay faster) | Paying too early reduces your own working capital buffer |
| CEI (Collections Effectiveness Index) | Percentage of collectible receivables actually collected | (Beginning AR + Sales − Ending AR) ÷ (Beginning AR + Sales − Current AR) | N/A, higher % is better | Low DSO with low CEI means write-offs are masking collection problems |
| AR Turnover Ratio | How many times receivables cycle through in a period | Net Credit Sales ÷ Average AR | N/A, higher is better | High turnover driven by write-offs overstates collection efficiency |
| Cash Conversion Cycle (CCC) | Total days between paying for inputs and receiving payment from customers | DSO + DIO − DPO | Better | Relevant mainly for product businesses; less applicable to pure service firms |
| Bad Debt Ratio | Percentage of AR written off as uncollectable | Bad Debt ÷ Total AR | Better | Artificially low DSO when write-offs remove aging receivables from the balance |
For most service businesses without inventory, DSO and the Bad Debt Ratio are the two metrics that matter most and are worth tracking at minimum monthly. The CEI adds useful nuance once you’re managing a larger client base where write-off rates become meaningful, typically once you’ve implemented the core AR automation workflow and need to diagnose whether remaining DSO issues are a speed problem or a collections quality problem.
How to Get Started: A 7-Step DSO Improvement Plan
This sequence is drawn from what actually worked, in the order that produced the fastest measurable results.
1. Calculate Your Actual DSO – Before You Change Anything
Pull your average accounts receivable balance and your total monthly credit sales for the last three months. Apply the formula: (avg AR ÷ monthly sales) × 30. Write the number down. This is your baseline, and without it, you have no way to measure whether any subsequent change actually worked. Time required: 20 minutes
2. Calculate Your DSO Efficiency Ratio
Divide your DSO by your average payment terms. A ratio below 1.15 means clients are paying close to on time, and your focus should be on the invoice delivery lag. A ratio above 1.50 means you have a collections process problem that requires more than just automation to fix, it may need a conversation about payment terms or client credit quality. Time required: 5 minutes
3. Fix Invoice Delivery Timing First
Configure your billing system to generate invoices on the same day as service delivery or milestone completion, not at the end of the week or month. For recurring billing clients, this means invoices auto-generate on the first of the billing period. For project clients, it means creating the invoice the moment you mark the deliverable complete. This single change typically saves 4–7 DSO days and costs zero in client relationship capital. Estimated DSO impact: 4–7 days
4. Set Up a Structured Reminder Sequence
Configure at minimum: a reminder 3 days before the due date, a day-of notice, and post-due follow-ups on days 3, 7, and 14. Write the reminder emails in your own voice before you configure them, impersonal automated reminders can feel like a change in relationship tone that works against the collection goal. Collection automation platforms let you configure this sequence once and apply it to every client automatically. Estimated DSO impact: 8–12 days
5. Offer Autopay to Recurring Clients and Add a Card Payment Option
Contact every recurring client and offer to set up autopay. Most will accept, it removes effort from their side too. For clients who pay manually, add a card payment option to your invoice emails and your client portal. Even if only half your clients switch, the ones who do will immediately move from 25+ day DSO to under 5 days. Estimated DSO impact: 5–10 days (on adopting clients)
6. Switch to Weekly DSO Tracking
Monthly DSO tracking tells you what went wrong last month. Weekly tracking lets you catch a deteriorating account before it becomes a problem. Set a 10-minute Friday morning review: open your AR aging dashboard, check anything 7+ days overdue, and flag any account that has missed two consecutive reminders for a direct personal contact. This is the rhythm that prevents surprises, not the software configuration, the software just makes the information available. Time required: 10 min/week
7. Recalculate DSO at 60 and 90 Days and identify what remains
At 60 days post-implementation, recalculate DSO and compare to baseline. Most of the improvement from steps 3–5 should be visible by this point. Whatever DSO remains above your target is worth diagnosing at the client level, segment by payment method, average invoice size, and billing model to identify whether any specific client type is still driving lag. A proper customer management setup makes this segmentation view available without manual analysis. Time required: 30 minutes per review
Related Reading on ReliaBills: If your AR aging report shows a cluster of invoices past 60 days despite automation, the issue may be invoice quality rather than collection process. Our guide on how to write a service invoice covers the specific invoice errors, vague descriptions, wrong billing contacts, and missing PO references that cause clients to pause payment pending clarification. And if your biggest DSO contributors are project clients on large contracts, the guide on how to offer payment plans covers how installment billing can reduce per-invoice DSO by breaking large balances into smaller, more manageable scheduled payments.
Frequently Asked Questions
1. What is days sales outstanding (DSO)?
Days sales outstanding is the average number of days between sending an invoice and receiving payment. Calculated as (Accounts Receivable ÷ Total Credit Sales) × Number of Days, it is the primary measure of how efficiently a business converts earned revenue into cash. For a service business, every additional day of DSO is working capital sitting in the receivables float rather than in your bank account.
2. What is a good DSO for a service business?
For professional services firms on Net 30 terms, a DSO of 30–45 days is typical; 30 or below is strong performance. A more useful benchmark than the absolute number is the DSO Efficiency Ratio, your actual DSO divided by your average payment terms. A ratio below 1.15 means clients are paying close to on time. Above 1.50 means the average client is paying 50% later than your terms allow, which is a structural issue worth addressing systematically.
3. How does billing automation reduce DSO?
Billing automation addresses the four main sources of DSO inflation: invoice delivery lag (eliminated by same-day automated invoicing), inconsistent reminder timing (eliminated by structured automated sequences), reconciliation lag (eliminated by automatic payment matching), and limited payment options (addressed by adding card and ACH through a payment portal). Together, these changes typically move DSO by 10–18 days within 90 days of implementation for a service business that was previously invoicing manually.
4. What is the DSO Efficiency Ratio and how do I calculate it?
The DSO Efficiency Ratio is your actual DSO divided by your average stated payment terms. If your DSO is 28 days and your average payment terms are Net 20, your ratio is 1.4, clients are paying 40% later than your terms on average. A ratio of 1.0–1.15 is excellent, 1.15–1.50 is acceptable with room for improvement, and above 1.50 indicates a collections process problem that warrants attention beyond basic automation.
5. What is the fastest single change that reduces DSO?
Based on my own data, same-day invoice generation, invoicing the moment work is delivered rather than at the end of the week or month, was the fastest single improvement, saving 4–7 DSO days within the first billing cycle after implementation. It requires zero change in client behavior and costs nothing to implement if you’re already using a billing platform. The Credit Pulse 2025 benchmark data corroborates this: invoicing within 24 hours of delivery reduces DSO by 5–8 days on its own.
6. Can a small service business meaningfully improve DSO?
Yes, and the proportional impact is larger for small businesses than for large ones because there’s no finance department to buffer the cash flow gap. For a solo consultant with $300,000 in annual revenue, cutting DSO from 28 to 14 days releases roughly $11,500 in working capital. For a 10-person agency at $1.2 million, the same proportional improvement releases over $46,000. No new clients, no price changes, just faster collection of money already earned.
7. How is DSO different from invoice aging?
Invoice aging shows you which specific invoices are overdue and by how many days, it is a snapshot of your current receivables. DSO is an average across all clients over a period of time, it is a trend metric. Aging reports tell you who to follow up with today. DSO tells you whether your collections process is improving or deteriorating over weeks and months. Both are useful; neither replaces the other.
The Bottom Line
Days sales outstanding is one of the most concrete and actionable financial metrics available to a service business, and it is significantly underused by small operators who think of it as an enterprise reporting tool. Every day of DSO is a dollar figure you can calculate in twenty minutes. Every lever that moves DSO is a change you can implement in an afternoon.
The businesses that improve DSO fastest are almost never the ones that start by negotiating tighter payment terms or adding aggressive late fees. They are the ones that fix the invoice delivery lag first, then build a consistent reminder sequence, then add payment method flexibility. In that order, for most service businesses, DSO improves by 10 to 15 days before any client conversation is required at all.
That is a structural improvement in how fast earned revenue becomes available cash, and at any scale, that matters.
Recent Articles:
- What Is Accounts Receivable Automation? (And Why It Matters in 2026)
- How to Apply Late Fees Automatically Without Damaging Client Relationships

Brant Pallazza is the Founder and President of ReliaBills, an invoicing and recurring billing platform built to help small businesses secure predictable cash flow. With over 20 years of experience in direct response marketing and e-commerce leadership, including a 13-year tenure managing over $500 million in gross sales at Digital River. Brant writes actionable guides on automated billing, payment processing, and scaling SMBs.