
Agency revenue reporting is not the same as agency billing. Revenue tells you what came in. Profitability reporting tells you what stayed. Most agencies track the first number reasonably well and the second number barely at all, which is how a client who bills $180,000 per year can quietly lose money quarter after quarter while the account feels healthy because the invoices always get paid.
What Is Agency Revenue Reporting?
Agency revenue reporting is the system by which a services firm tracks what it earns from each client, what it spends to deliver that work, and what margin remains after costs are deducted. For most agencies, revenue is visible because it flows through invoices. Costs are partially visible because payroll and direct expenses appear on the P&L. What is almost never visible is the connection between the two at the client or project level: which specific accounts are generating positive margin, which are breaking even, and which are consuming more in staff time and direct costs than the retainer or project fee covers.
The definition matters because the phrase “revenue reporting” is often used to mean invoice tracking or cash flow monitoring, which are related but different. Invoice tracking tells you whether clients are paying. Cash flow monitoring tells you whether you can make payroll. Agency revenue reporting in the full sense produces a profitability view by client that tells you which relationships are worth growing, which need to be repriced, and which are costing you money that would be better deployed elsewhere.
The Client Profitability Problem Agencies Don’t See Coming
The scenario plays out the same way in agencies of every size: a client who always pays on time, never complains, and renews their contract annually is internally treated as a good account. Then someone runs the numbers. The account is billing $15,000 per month. The team logged 210 hours last quarter on a scope that projected 150. Two senior account managers are spending 30% of their time on this client. The net margin, once staff time is loaded at cost, is 8%. The agency’s target is 25%.
The client is not bad. The contract is underpriced, the scope is over-delivered, and nobody noticed because the invoice always got paid and the client relationship always felt positive. This is the most common form of margin erosion in agency businesses, and it is almost entirely invisible without a system that tracks cost against revenue at the client level.
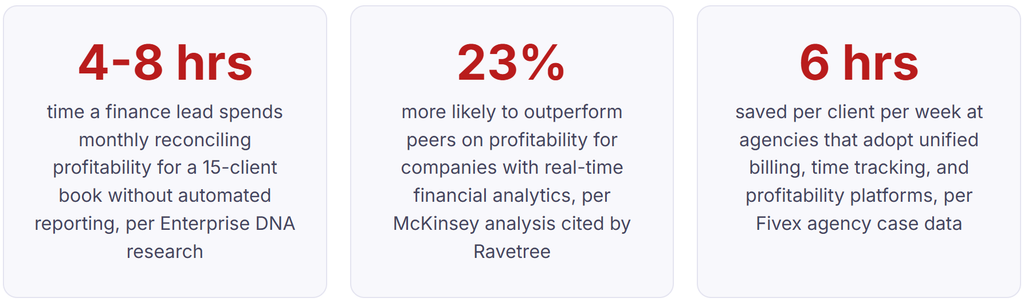
The reconciliation problem is structural: agency revenue data lives in one tool (invoicing), cost data lives in another (time tracking), expense data lives in a third (accounting software), and project data may live in a fourth (project management). Reconciling those sources into a profitability view is a monthly ritual that no one enjoys and everyone resents. Your finance lead exports timesheets. They pull invoices from QuickBooks or Xero. They grab expense reports. They open the media buy log. The process takes four to eight hours for a 15-client book.
That is time spent producing a number that describes the past rather than enabling action in the present.
What Your Client Profitability Report Must Show
A client profitability report is only useful if it shows the right data in the right structure. Below is a realistic view of what a 10-client agency’s profitability dashboard should look like, showing the columns that actually drive decisions versus the ones that feel like reporting but do not change anything.
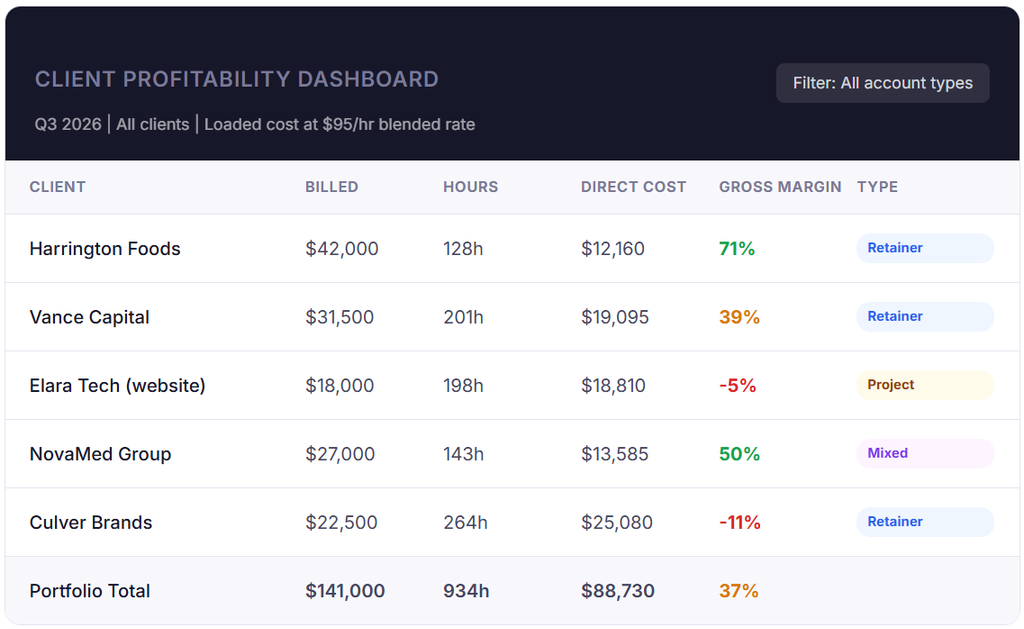
The two accounts highlighted in red, Elara Tech at -5% and Culver Brands at -11%, are actively losing money on a gross margin basis. Every hour of staff time allocated to those accounts costs more than the revenue it generates. Without this view, both would appear on the agency’s books as paying clients whose invoices are current. With it, the decisions are clear: Elara Tech is a project that was underscoped and needs a change order or a conversation about what is left in scope. Culver Brands is a retainer that needs to be repriced, rescoped, or exited before another quarter passes.
The portfolio total of 37% gross margin also tells a story about the business. If the agency’s blended overhead rate requires 30% gross margin to cover all indirect costs and reach breakeven, a 37% portfolio average looks acceptable on the surface. But two accounts at negative margin and one at only 39% suggests the overall health is being carried by the two high-margin accounts, which is a concentration risk that the portfolio view makes visible.
How the Reporting Stack Connects: From Time to Margin
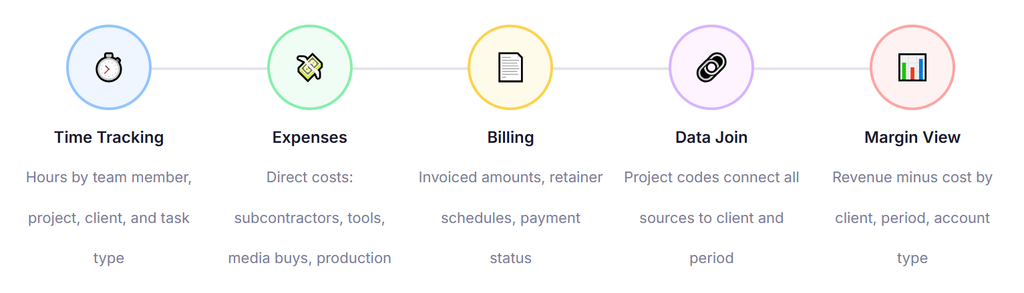
The client profitability view above does not come from a single tool. It comes from connecting four data sources that typically live in separate systems and requires a deliberate integration decision at each connection point.
1. Establish a universal project code structure before anything else
The single highest-leverage action an agency can take before evaluating any reporting software is standardizing project codes across every tool in its stack. Every time entry, every expense, and every invoice line item that relates to a specific client engagement should carry the same project code. Without this, data from different systems cannot be joined without manual interpretation, which is what produces the 4-to-8-hour monthly reconciliation that (cite index=”19-1″>no one enjoys and everyone resents. The project code structure is a naming convention decision, not a technology decision, and it takes a half-day to design and an afternoon meeting to implement across your team.
2. Define your loaded cost rate per role or team member
Gross margin calculations require knowing what each hour of delivered work costs the agency, not what you would like to bill for it. The loaded cost rate for a team member is their annual salary plus employer taxes and benefits, divided by available billable hours per year, plus an allocation of indirect overhead (rent, software, management time). For most agencies, the blended loaded cost rate across the full team lands between $65 and $110 per hour. Using the fully loaded rate rather than just salary makes the margin calculation realistic rather than optimistic.
3. Connect billing data to client records with payment and contract history
Your billing records carry information that is essential to profitability analysis: what was contracted (the scope and fee), what was actually billed, and whether the payment terms reflect the account’s risk profile. A client on Net 60 terms who historically pays at day 75 carries a receivables cost that a profitability calculation should acknowledge. Connecting your customer management layer to your billing data ensures that retainer renewal dates, contract value changes, and payment term configurations are visible alongside the margin data for each account.
4. Choose your reporting layer based on where the primary pain is
Agencies with a primary pain in time tracking accuracy and scope management typically benefit most from all-in-one agency management platforms like Harvest plus QuickBooks, Productive, or Teamwork. Agencies where the primary pain is billing complexity, retainer management, and cash flow forecasting may find that a dedicated billing platform with robust recurring billing and customer management handles the financial layer more accurately than an all-in-one agency tool’s billing module. Evaluate both categories against the specific reporting outputs you need, not against feature checklists.
5. Review client profitability monthly, not annually
A profitability review that happens once per year at contract renewal time discovers problems that have been compounding for months. A monthly review that takes 30 minutes using a live dashboard identifies scope creep and underpricing within the billing period, when there is still time to act: have a contract conversation, issue a change order for additional scope, or have an internal decision about whether to reprice at renewal. The operational discipline of a monthly review matters more than the sophistication of the tool you use to run it.
Real-World Use Cases by Agency Type
Digital marketing and creative agencies
For creative and digital agencies, the profitability gap most commonly comes from revision cycles and approval delays that consume hours not scoped in the original estimate. A brand identity project scoped for 80 hours of creative time that runs to 140 hours because the client requested seven rounds of revisions has a negative margin on the creative phase regardless of what the project billed. Reporting software that connects time entries to project phase budgets, and flags when a phase is within 80% of its allocated hours, gives account managers a warning before they cross into margin-negative territory rather than discovering it in the month-end reconciliation.
Media and advertising agencies
Media agencies have a specific profitability reporting challenge that other agency types do not share: media pass-through costs. When an agency buys $200,000 in digital media on behalf of a client, passes it through at cost, and earns a 15% management fee, the gross revenue line on their P&L shows $230,000. But 87% of that is a cost pass-through with no margin. Reporting that includes media pass-throughs in revenue without clearly delineating them inflates both revenue and apparent profit until the true economics are visible. A reporting structure that separately tracks agency-earned fees from media pass-through volume is essential for understanding the actual economics of a media agency book of business.
Retainer-heavy consulting and strategy firms
Strategy and consulting firms that operate primarily on monthly retainers face a different problem: the retainer amount is fixed, but the time required to deliver the work is variable. A client whose account is managed by a principal billable at $200/hour who is spending more hours on that account than the retainer covers at any reasonable rate is producing negative contribution margin on principal time, even if junior support hours are well within scope. Profitability reporting needs to show cost by team member role, not just aggregate hours, to surface this dynamic.
Key Benefits of Structured Agency Revenue Reporting
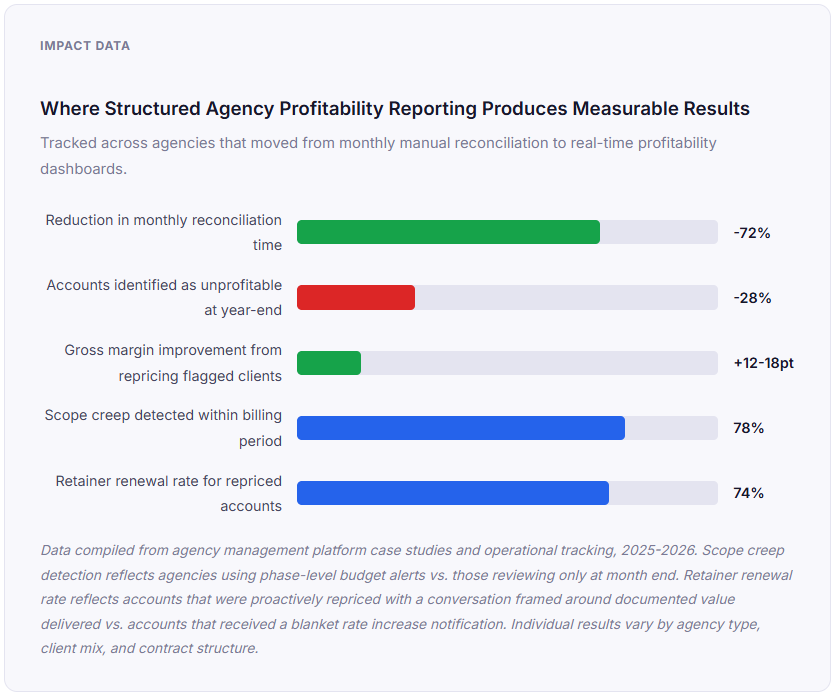
Risks and Blind Spots in Agency Financial Reporting
Revenue recognition timing mismatches
An agency that bills a retainer on the first of the month is tempted to recognize that full month’s revenue on day one. But if the team delivers the retainer work throughout the month, recognizing revenue at billing rather than at delivery creates a timing mismatch that inflates apparent revenue in billing months and deflates it in delivery months. For agencies with significant retainer books and variable delivery timing, this mismatch can meaningfully distort month-to-month profitability trends without affecting the annual total.
Overhead allocation that does not reflect actual delivery cost
Many agencies use a blended hourly rate for all staff when calculating project cost, which simplifies the math but can significantly misrepresent the true cost of specific accounts. An account that is disproportionately served by senior staff (whose loaded cost may be 2 to 3 times junior staff) will appear more profitable at a blended rate than at role-specific rates. For a portfolio with diverse account types, using role-specific cost rates rather than a blended average produces a materially more accurate profitability picture.
Unbillable time that does not connect to any client
Internal meetings, business development time, admin work, and new client pitches are real costs that the agency absorbs. When these hours are not tracked and allocated to an overhead pool, they are effectively invisible in the profitability model, which means the model is systematically overstating actual billable capacity and the margin calculations for individual clients are slightly optimistic. Tracking all time, including non-billable internal time, and allocating it correctly in the overhead model is what makes the profitability calculation defensible against the actual economics of the business.
Comparison: Agency Reporting Approaches
| Approach | Profitability by Client | Real-Time Visibility | Scope Creep Detection | Billing Integration | Best For |
|---|---|---|---|---|---|
| Manual spreadsheet reconciliation | Monthly, labor-intensive | None | After-the-fact | Manual export | Agencies under 5 clients |
| Accounting software (QuickBooks/Xero) only | Revenue visible, costs require tagging | Delayed | None | Strong | Small agencies, finance-focused reporting |
| Time tracking + accounting (Harvest + QBO) | With setup, yes | Semi-real-time | Via budget alerts | Good | Service agencies with hourly or T&M billing |
| All-in-one agency platform (Productive, Teamwork) | Built-in | Real-time | Phase-level alerts | Basic billing modules | Mid-size agencies, complex project mix |
| Billing platform + agency analytics layer | Billing side strong, cost side requires integration | Real-time billing | Requires PM tool | Native | Retainer-heavy agencies where billing complexity is the primary pain |
What I Got Wrong at First: Common Agency Revenue Reporting Mistakes
Mistake 1: Confusing high-revenue clients with high-margin clients
The first instinct in any agency is to protect the largest accounts. They bill the most, they feel the most important, and losing them would be most visible on the income statement. But client size by revenue and client quality by margin are different, and treating them as synonymous leads to misallocating the best team members to accounts that generate the least net value. The agency’s most valuable clients are not the ones that bill the most. They are the ones where the billed amount most exceeds the delivery cost, and that ranking is almost never identical to the revenue ranking.
Mistake 2: Building the profitability report only at annual contract renewal
An annual review of client profitability tells you how profitable each account was over the past year. It does not tell you whether an account that was profitable in Q1 became unprofitable in Q3 because of a team change, a scope expansion that was not contracted, or a billing rate that did not keep pace with staff cost increases. Monthly profitability review is what converts the report from a historical document into an operational instrument. The goal is to identify margin degradation within the quarter it happens, when a repricing conversation is still early and constructive rather than urgent and defensive.
Mistake 3: Not tracking time on retainer accounts because the billing is fixed
The logic sounds reasonable: the client pays a flat monthly retainer, so there is no need to track the hours. The problem is that without tracking hours on retainer accounts, there is no way to know whether the retainer is covering the cost of delivery. A retainer that made sense at the original staffing model may become unprofitable when a more senior account manager takes over the relationship and brings higher loaded cost, or when the client’s monthly request volume increases beyond what the original scope anticipated. Time tracking on retainer accounts is not for billing purposes. It is for profitability monitoring.
Mistake 4: Using gross revenue as the presentation layer for new business decisions
Agencies that evaluate new business opportunities based on revenue potential rather than margin potential are prone to accepting work that looks attractive on the top line while eroding average portfolio margin. A new client offering a $20,000 monthly retainer that would require significant senior time, specialized subcontractor support, and complex deliverables may produce lower actual margin than a $9,000 retainer with a well-defined scope and primarily junior delivery. The discipline of projecting gross margin for new business opportunities before accepting them, using the same loaded cost model as the existing portfolio, prevents the margin dilution that comes from revenue growth without profitability discipline.
Mistake 5: Managing billing and profitability in separate systems that do not talk to each other
An agency that tracks time in one tool, manages projects in a second, invoices from a third, and reviews profitability in a monthly spreadsheet has four separate data entry points that must be reconciled before a profitability view can be produced. Each handoff between tools is a point where errors accumulate: time entries attributed to the wrong project, invoice line items that do not map to project codes, expenses recorded without a client tag. Platforms like ReliaBills connect recurring retainer billing, client records, and payment history in one place, reducing one of those handoff points. The more your reporting stack can ingest from a single source of truth rather than reconciling across multiple, the more reliable and timely the margin data will be.
How to Get Started
The most impactful first step for most agencies is not selecting a reporting platform. It is producing a single client profitability view for last quarter, using whatever data is currently available, however imperfect. That exercise will reveal where your data gaps are (typically: missing time data for retainer accounts, expenses not tagged to clients, and billing that does not match the project scope history) and give you a concrete set of requirements to evaluate any reporting tool against.
Define your client tiers after that first profitability view. Most agencies find their accounts fall into three natural groups: consistently profitable accounts that deserve investment, accounts with decent revenue but degraded margin that need a repricing conversation, and accounts that are costing money and need a difficult decision. Acting on the middle tier is where the highest leverage is, because repricing is almost always less expensive than client replacement and the profitability improvement from successfully repricing two or three mid-tier accounts typically has a larger impact than winning one comparable new client.
For the billing infrastructure side, connecting retainer and project billing to a system that tracks payment history, manages contract terms, and produces clean receivables data by client gives your profitability model a reliable revenue input. Platforms that support both recurring billing for monthly retainers and installment billing for project fee structures allow you to handle your full billing mix within the same client record, which means the revenue side of the profitability equation is always current without manual reconciliation between billing and accounting data.
Frequently Asked Questions
1. What is agency revenue reporting?
Agency revenue reporting is the process of tracking and analyzing the revenue an agency generates from its clients, accounts, services, and projects. It typically includes contracted revenue, recurring retainers, project fees, and other billable services, while separating pass-through costs such as media spend or third-party expenses so the agency can understand its actual revenue and financial performance.
2. How do you calculate client profitability in an agency?
Client profitability is generally calculated by subtracting the direct costs associated with serving a client from the revenue generated by that client. These costs can include employee or contractor time, production expenses, software, freelancers, and other delivery costs. A simple formula is Client Profit = Client Revenue − Direct Client Costs, while Client Gross Margin = (Client Revenue − Direct Client Costs) ÷ Client Revenue × 100. The more accurately an agency captures revenue and delivery costs by client, the more useful the profitability analysis becomes.
3. Why do agencies struggle with client profitability reporting?
Agencies often struggle with client profitability reporting because revenue and costs are spread across multiple systems, teams, projects, and billing structures. Time may not be tracked consistently, shared overhead can be difficult to allocate, pass-through expenses can inflate revenue figures, and fixed-fee work can obscure the actual amount of effort required to deliver an account. Without consistent client-level data, agencies may know which accounts generate revenue but not which ones generate sustainable margins.
4. What is a good gross margin target for agency accounts?
There is no single gross margin target that applies to every agency because margins vary by business model, service mix, pricing structure, staffing model, and the extent of third-party or pass-through costs. Instead of relying on one universal benchmark, agencies should establish internal targets based on their economics and compare actual margins across clients and service lines. Tracking gross margin consistently can help identify accounts where pricing, scope, staffing, or delivery efficiency may need attention.
5. How do you handle media pass-throughs in agency revenue reporting?
Media pass-throughs should generally be separated from the agency’s underlying service revenue so that large media budgets do not make an account appear more profitable or productive than it actually is. Agencies can track the client’s total spend, media costs, agency fees or markup, and other service revenue as separate components. This makes it easier to distinguish money flowing through the agency from revenue the agency actually earns for its services.
6. Should agencies track time on fixed-fee retainer accounts?
Yes, agencies can benefit from tracking time on fixed-fee retainer accounts even when clients are not billed by the hour. Time tracking provides visibility into how much internal effort is required to deliver the agreed scope and allows the agency to compare the fixed fee with its actual delivery cost. This helps identify accounts that are consistently over-serviced, evaluate client profitability, improve staffing and resource planning, and inform future pricing or scope discussions.
Recent Articles:
- How to Track MRR and ARR for Tech Companies with Reporting Software
- Customer Data Management for Fitness Studios: Organize Member Profiles and Billing