

As a business, it’s essential for you to know the rate of customers or clients that you have. The customer is a vital piece to your business as they are one of the entities that are keeping your business afloat. That’s why you need to be mindful of the number of customers that you currently have, as well as the rate of employees that leave your company at a certain period. This instance is called Churn Rate, and you’re going to learn a lot about it in this comprehensive article. We’ll discuss why this happens, how to calculate your churn rate, and how you can deal with it.
What is Churn Rate?
Churn rate, also known as customer churn, revenue churn rate, or rate of attrition, is the percentage of customers who stop doing transactions with a particular business. It’s most commonly expressed as the rate of service subscribers discontinuing their subscription within a given period. If you’re a small business and you’re trying to grow your clientele, you need to get familiar in dealing with customer churn rates. Essentially, your company’s growth rate (measured by the percentage of new customers) must exceed its churn rate.
Why Is Churn Rate Hard to Understand?
The fundamental calculation is pretty straightforward. However, the complexities start when you weigh in other factors like how those two numbers are defined and other external factors.
Counting Customers
The total number of customers for a given period, say, a month, isn’t a well-defined concept. The reason is that the value will change during the month due to subscription cancelations and new sign-ups. For a given month, you have three kinds of customers to determine:
- Customers that signed up prior to the month. These customers will come up for renewal in the current month.
- New customers during the month.
- Customers who churned during the month.
The Moment of Churn
The moment of churn is defined in two ways:
- At the moment the subscription ends, and renewal doesn’t happen.
- At the moment of cancelation.
Sample Size
Simply put, we don’t have much data regarding the number of cohorts and how they behave over time. It can also cause wild fluctuations, making it challenging to compare churn rates every month.
Time Frame
In terms of period, you may be looking at customer churn rate over the span of a week, month, quarter, or even an annual churn. You also want a robust calculation with respect to the given time period.
Customer Segments
An aggregated value will dissolve the differences between your customers, which can lead you to a misunderstanding of your churn number if you simply take it at face value.
Seasonality
If your business varies differently per season, your churn rate may show changes that correspond with the seasonality of your business.
Other Metrics Affected by Churn Rate
- (MRR) or Monthly Recurring Revenue: If your customers leave, your revenue will take a hit. In the SaaS industry, monthly recurring revenue is only the lifeblood of your company, but it’s also a crucial indicator of long-term viability. A customer churn decreases your income directly.
- (LTV) or Customer Lifetime Value: The lifetime value of a customer is an indication of a SaaS company’s longevity. Customer churn can lower LTV directly because when users leave, the revenue of your company decreases.
- (CAC) or Customer Acquisition Costs: If you’re spending money to acquire customers and they churn before you even earn back those costs, you are running at a tough deficit. Churn rate increases your average CAC. If you reduce your churn, you can secure your CAC at a quicker pace.
What Can Churn Be Used For?
Churn can be used in a series of different ways. Specifically, it can be used for the following:
- A measurement of the company’s status and long-term prospects.
- Understand whether a company is improving its customer retention on a monthly basis.
- Identify changes that had negative effects on customer retention.
- Calculate customer lifetime value.
- Determine which customers are more effective and successful with your product.
- Forecast and report your company’s overall performance for a given period.
These are just some of the common ways that you can use your churn rate. As you can see, while churn is a negative rate, it can also lead to better statistics moving forward. By working around your churn and using it as basis for improvement, you can propel your business to new heights and greater revenue.
How To Calculate Churn Rate?
At its core, calculating your churn rate is a simple concept: it’s the percentage of your customer that leave or discontinue your service divided by the total number of customers over a given time period. However, that’s just the tip of the iceberg. When you dive deep, you can discover a wealth of complexity behind this seemingly simple calculation. The churn rate formula can be calculated as the value of churned divided by the total number of customers.
Steve Noble, a professional data specialist at Shopify, formulated four fundamental ways to calculate churn rate:
- Simple
- Adjusted
- Predictive
- The “Shopify” Method
Take note of the following terms:
- Churned Customers: the number of customer churns in a specific period.
- n: the number of days in your chosen time frame. When you calculate over a month, n = 28,29, 30, or 31.
- Customers: a list of the numbers of customers on any given day i, 1 through n. For example, Customers_1 is the total number of customers that you had on the first day of the period.
1. The Simple Method
The simplest way to calculate your churn is the one we mentioned a couple of times:
Simply put, you’re dividing the total amount of churned customers over the period by the total number of customers you had on the first day.
Pros:
- Simple and easy to execute.
- Easy to understand and quick to calculate.
- All you need is those two numbers for each month to compare your monthly churn.
Cons:
- It has a hard time dealing with significant growth.
Example:
Here’s an example from Shopify, illustrating the limitations of the Simple method:
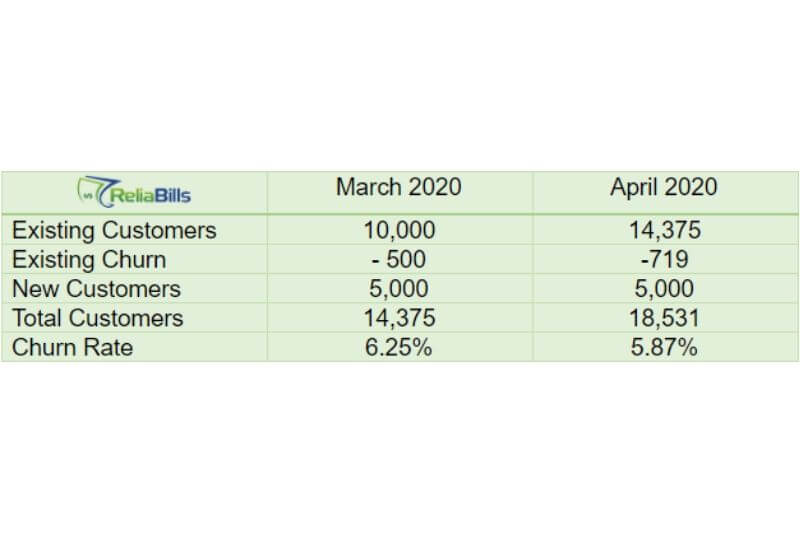
Start with the number of customers at the beginning of March (10,000). The company loses 500 (5%) of its customers; however, it acquired 5,000 new ones throughout the month. In that number, 125 (2.5%) churn out. As a result, the churn rate is 6.25% for March.
625/10,0000 = 0.0625
Starting April with 14,375 customers, you see a similar behavior this month, with 719 (5%) of existing users churning, 5,000 new customers joining, and 125 (2.5%) new customer churn. The simple churn rate for April is 5.87%.
844/14,375 = 0.0587
So, what happened? You’ve been seeing the same behavior in the past two months. However, the churn rate for each of those two months is different from each other. It might look like your churn has reduced, but the underlying behavior has remained the same.
Your high growth has distorted your calculation. In March, 125 churned customers are added to the numerator; however, 5,000 new customers that joined in March didn’t get added to the denominator. Because of that, the churn rate is artificially high. In the following months, the growth is less proportionally to the existing customer count, which makes the effect lessened.
2. The Adjusted Method
To address monthly growth, take the midpoint of the customer count for the month, instead of using its value on the 1st day of the month.
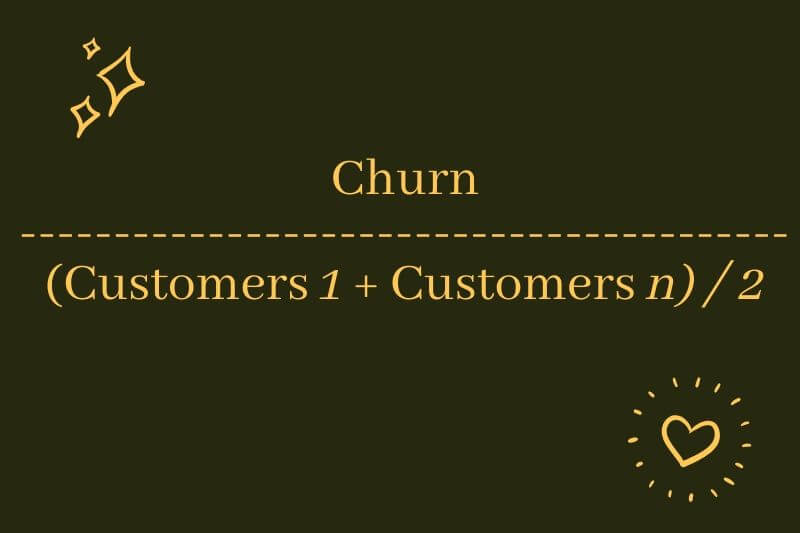
In this formula, we’re dividing the number of churned customers by an adjusted average of the rate of customers throughout the period.
Pros:
- Deals with the growth issue by normalizing changes in total customers over the time period.
- A more stable way to base revenue churn.
- The time window for your total customers is the same as your time window for churn.
Cons:
- Fails to scale with different time periods.
- You can get different results for daily, weekly, monthly, quarterly and even annual churn rates.
Example:
Using the Shopify data again, now with added May 2020:
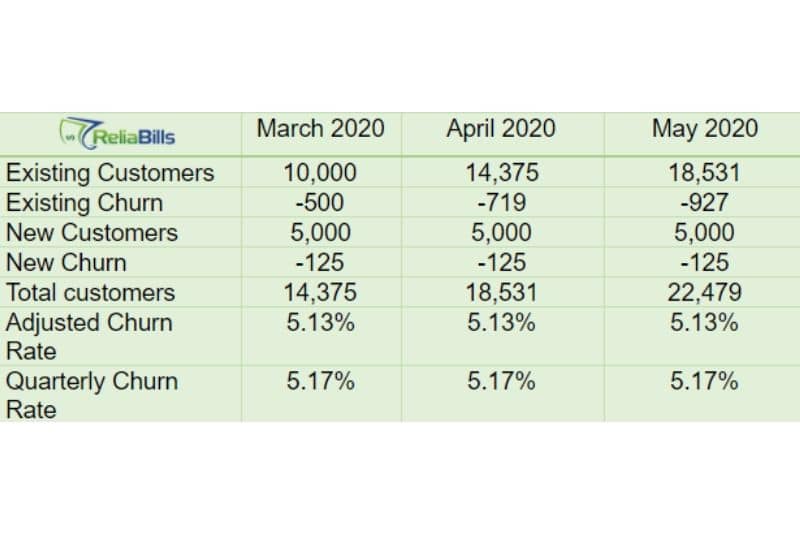
Now, we can see the churn rate as the same, even with a different number of customers at the start of the month.
- March: 625/12,187 = 0.0513
- April: 844/16,453 = 0.0513
- May: 1052/20,505 = 0.0513
- Quarter: 2,521/ 16,239.5 = 0.1552
There you go – problem solved! We can stop now and call it a day.
But wait, there’s an issue that you didn’t notice. The problem with this approach is that it makes assumptions about the data. If you calculate this over three months, you come out with a churn rate of 15.52%. Divide this across the three months, and you get 5.17%, which is very close to the individual monthly churn rates. So far, so good.
But what if you don’t have precisely the same numbers across each month? Let’s consider March as a bad month with only 100 new customers, with 2 churns.
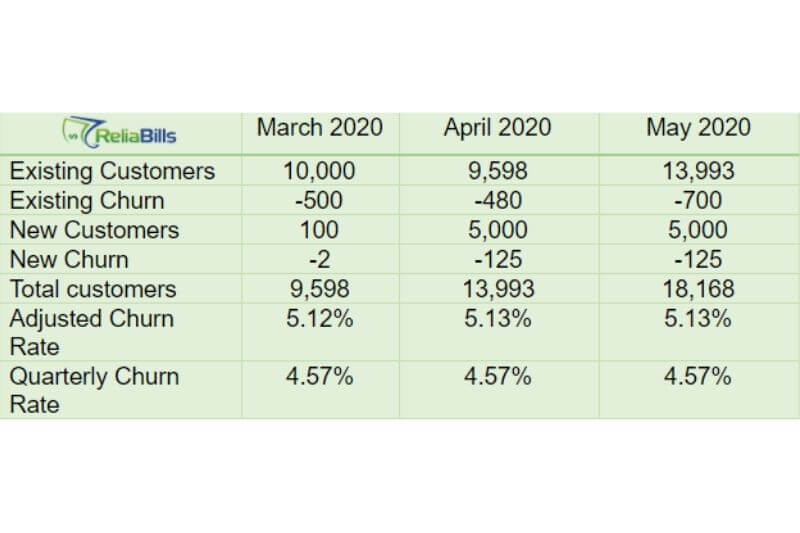
As you can see, the behavior is the same in terms of churn (5% of the existing customers and ~2.5% of new users). When calculated individually, each month shows the same customer churn rate of 5.13%.
However, when calculated as a quarter, you get a 3-month revenue churn rate of 13.7%, which divided across each month results to 4.57%.
- March: 502/9799 = 0.0513
- April: 605/11,795.5 = 0.0513
- May: 825/16,080.5 = 0.0513
- Quarter: 1932/14,084 = 0.1371
The monthly churn rates no longer tally with the quarterly churn rate, despite them using the same data. The change in the time period in the calculation is the prime suspect. This approach assumes that churn is spread evenly within the time frame, with a linear distribution. A good churn rate ratio should contract or expand well with the length of time that it measures, while still delivering comparable results.
3. The Predictive Method
A google churn rate calculation should provide actionable advice. This method tries to incorporate a predictive element into the equation. It determines a weighted average churn rate so that rate*customers will predict the likely churn rate on any given period. In this method, we use this formula:
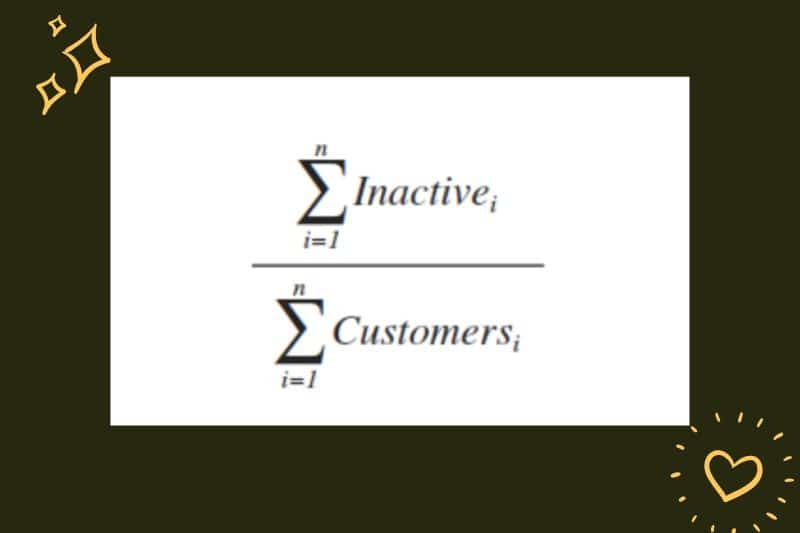
InactiveCustomers is an array of how many active customers on day i are inactive on day i+n (i.e., one month later) if you have 1,000 customers on April 1, you then look forward in time to see how many of that number have churned on May 1. You sum that up and divide it by the sum of total customers in April.
Pros:
- Great for predicting your churn.
- Excellent for planning your finances ahead.
Cons:
- Requires two months’ worth of data to run a single month’s calculation.
- To determine your churn rate for this month, you have to wait until the end of next month.
Churn is supposed to keep you up-to-date on your company’s success. If you have a number of accounts cancel in April, you won’t have this information until May. The flip is that when you do get to the end of May and have a churn rate, it’s now from a month ago. It’s no longer the current. You can’t report churn rates to your employees for the prior month. Instead, you’re telling them what happened a month ago.
4. The Shopify Method
Last but certainly not least is what Noble calls, the Shopify Method. It’s what he’s been using and has produced the most reliable results. Instead of roughly taking the average of the first and last days of the month as we do with the adjusted method, we take the average of every day in the month to get a more accurate calculation. Here’s what the formula looks like:
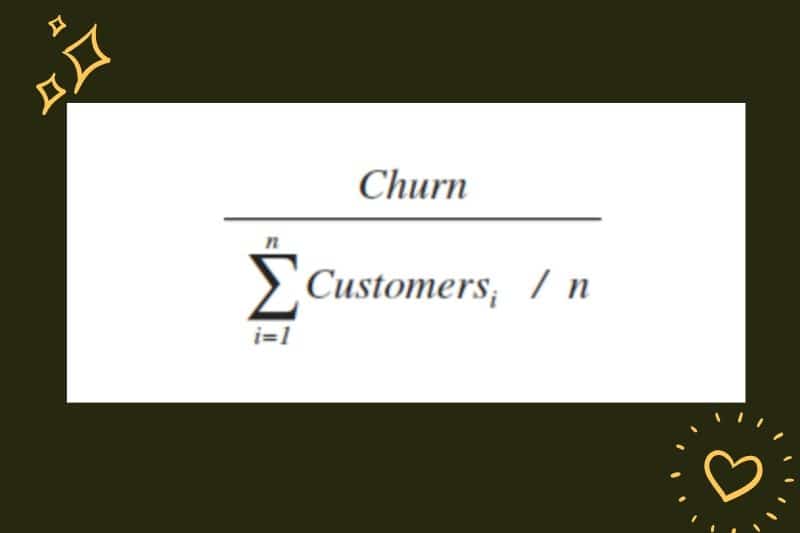
As you can see, you divide your number churned by the average of your customer count between days one and n.
Pros:
- Deals with the issues that are plaguing the other formula variations.
- Can be used in periods of high growth.
- Scales nicely across different time windows.
- Can also be used in a timely manner so you can get an accurate and up-to-date churn rate.
Cons:
- There are variations in your numbers that this calculation won’t be able to account for.
- New customers churning at a higher rate than older customers, the differences in cohorts, in plans, in size of account; none of these metrics is captured in this formula.
- You can have a false sense of security that the number they get each day, week, month, or quarter is the entire story of their churn.
Which One to Choose?
If your business is fairly new and growing, we suggest that you choose a less complicated formula. The less complex formula is the lesser chances of making errors. So make sure you go with the Simple method first with the monthly time period, before you work your way towards more complex formulas once your business starts to grow.
How To Reduce Churn Rate?
Reducing your churn rate is pretty complicated as there isn’t a one-shoe-fits-all method. Every business has a unique situation, and the churn rate varies tremendously. That’s why we’re giving you an example instead to give you an idea of how you can tackle your churn rate and reduce it to a more controlled percentage.
Netflix is an example of a company that manages its churn rate pretty well. With over 90 million customers, there’s no doubt that the company has developed a clear system for controlling their churn rates. In fact, the company has a steady 9% churn rate, which is the lowest of any other subscription streaming service. With that incredibly small number, you can’t help but wonder – how does a large service company like Netflix continue to keep their customers engaged for both short and long term? Here’s how they do it:
The Importance of Engagement
Like all subscription companies, the best way Netflix can take to reduce churn is to create a product that people are willing to pay for. Their solution is to provide a large library of original and licensed content. As long as people keep watching, they will keep renewing their subscription to Netflix.
Reluctant to Switch
Recent research shows that only 4% of U.S.-based broadband users cancelled their Netflix service – representing almost 9% of Netflix’s subscriber base. This data shows that most households are electing to keep their Netflix subscription instead of “testing the waters” with other streaming services like Amazon Prime and Hulu Plus. Netflix is so ahead of the pack that they manage to keep a strong subscription base with less churn rate. But what is it that draws their customers back to them?
User Preference
One of the reasons that make Netflix so irresistible among its customer base is its original shows. With fan favorites like Riverdale, Elite, and House of Cards, Netflix is in full control of what its customer base is watching. What’s more, is that they’re not just skimping the surface. They’re looking at things like:
- The number of users that watched a particular episode.
- The number of users that watched an entire series.
- The gap between when the user watched one episode and the next.
At the same time, they’re also gathering data based on:
- When a user pauses, rewinds, or fast-forwards.
- The day users watch.
- The date and time that users watch, as well as the zip code that they’re watching from.
- The devices users use to watch.
- The rating users give and the searches they conduct.
Essentially, there are a lot of data that they gather. From there, they will then provide each user with the appropriate content based on his or her preferences. This will then drive user engagement through the roof, and will eventually result in them renewing their subscriptions each month.
How Recurring Billing Helps Reduce Churn Rate
To prevent customer churn, you need to develop an easy and convenient way to make payments without your business being too invasive. One way to do that is by setting up an automated recurring billing process. If you’re running a subscription-based business or any other type of business that requires you to bill your customers regularly, having a recurring payment process is the ideal way to get paid without annoying your customers into leaving.
Automating your billing process means your customers will receive your invoice regularly via email. They will also make payments according to the payment options that you offer, and you’ll get paid on time without having to beg your customers to pay you.
ReliaBills has an impressive recurring billing system that will offer you everything you need to bill your customers and get paid automatically. From creating your invoice to sending them to your customers and getting paid, ReliaBills automates everything so that you won’t have to do any strenuous invoicing work.
If you’re billing your customers the same amount per payment cycle, all you need is to create an invoice, provide all the relevant details, schedule payment, set it to ‘recurring,’ and you’re all set. If you want to make changes like the payment amount or other details in your invoice, you can do so whenever you need to. When you set everything, ReliaBills will automate the entire process so you won’t have to.
Your customers will appreciate you more for sending them a proper invoice on time. Remember, the more you impress your customers, the more you keep them happy. And the more you keep them happy, the longer they will stay and acquire your services again. With recurring billing, your churn rate lessens, and your customer retention rate will improve.
What Other Things Can You Get from Recurring Billing?
- Steadier cash flow. With recurring billing, you’ll be adding customers a lot more than losing them, which, in turn, will result in a more stable cash flow.
- Better Accounts Receivable. Once you automate your payment processing, you will no longer have to pay for your customers to make payments. Everything is done automatically, so you won’t have to spend more on collection costs.
- More time for what matters the most. Your business needs your full attention to combat customer churn. By automating your payment process, you can work on other areas of your business while your billing system works in the background.
Recurring billing is a simple solution that you can use whenever you need it. It’s also a cost-effective solution that can help you win more customers. Whether you’re running a service or product-based business, you can utilize recurring billing as the ideal billing strategy.
Other Methods
Apart from that, Netflix, emails and push notifications to offer recommendations to their customers. This level of commitment to their users has given Netflix a complete edge over their competitors, not to mention keeping their churn rate at bay and never be an issue that they’ll need to worry about now or the foreseeable future.
So as you can see, you can also replicate Netflix’s method to reduce your churn rate. While you can’t replicate it completely, you can start by creating a method to increase user engagement. Keep your users wanting more and give them a reason to stay. That’s the only thing you need to know.
Best Churn Tracking Tools Available Right Now
Tracking and calculating your churn takes a lot of time to do manually. That’s why you need to invest in effective churn tracking tools.
How to Create a New Recurring Invoice Using ReliaBills
Creating a New Recurring Invoice using ReliaBills involves the following steps:
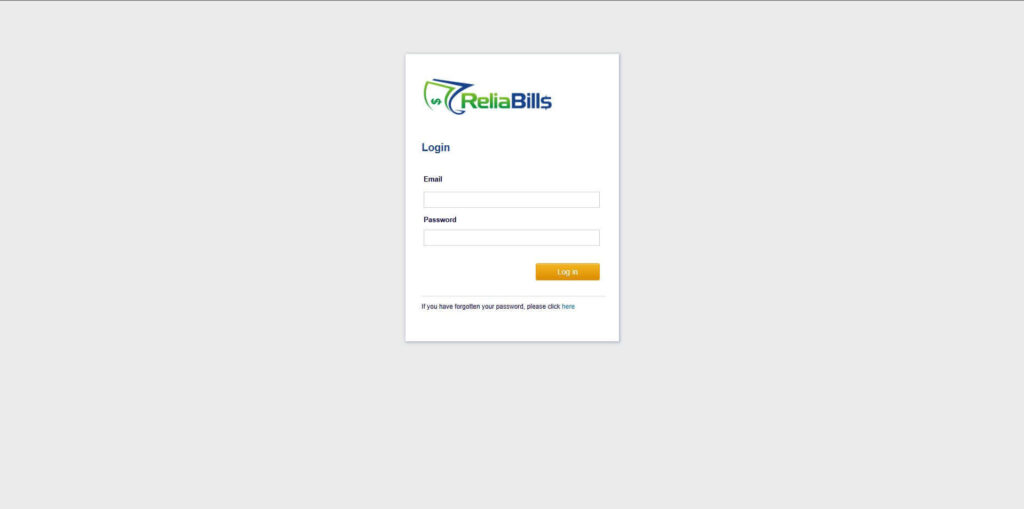
Step 1: Login to ReliaBills
- Access your ReliaBills Account using your login credentials. If you don’t have an account, sign up here.
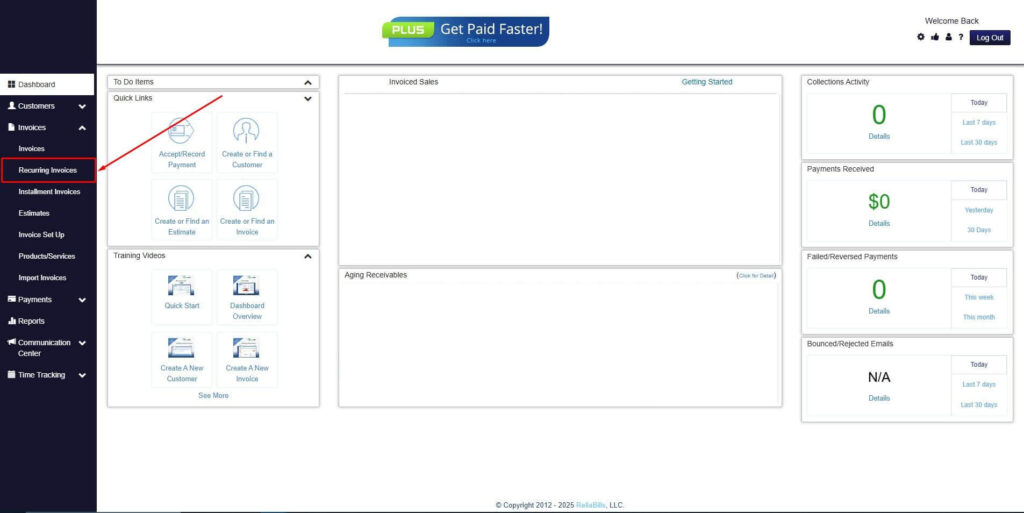
Step 2: Click on Recurring Invoices
- Navigate to the Invoices Dropdown and click on Recurring Invoices for an overview of the list of your existing customers.
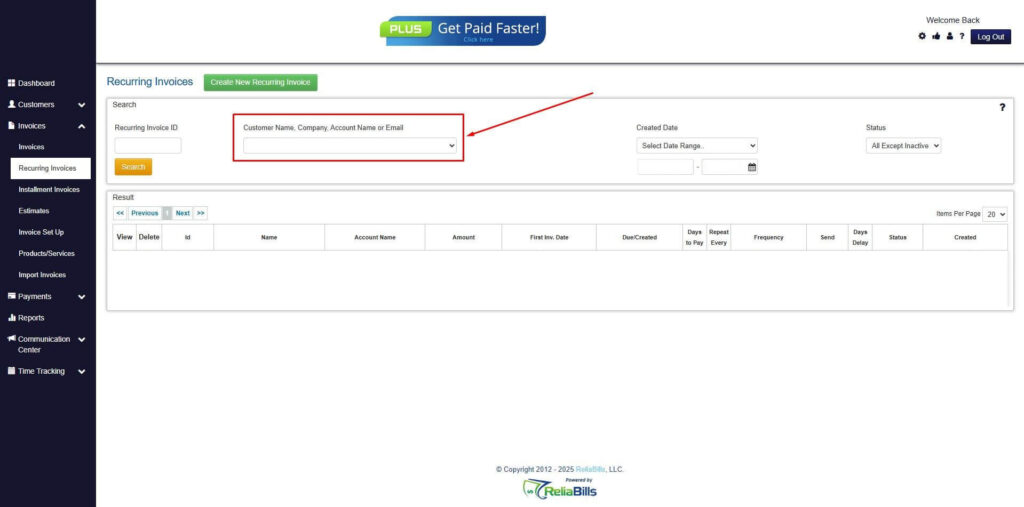
Step 3: Go to the Customers Tab
- If you have already created a customer, search for them in the Customers tab and make sure their status is “Active”.
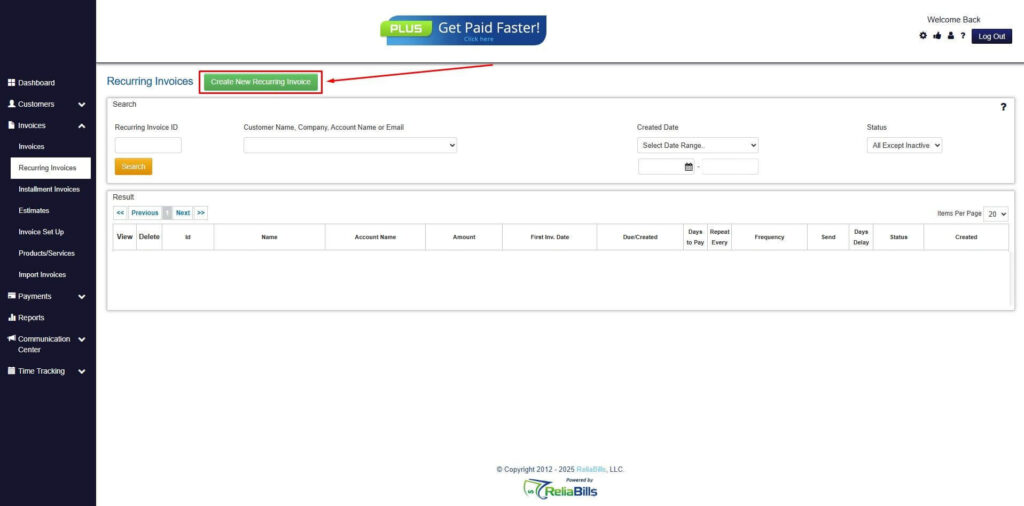
Step 4: Click the Create New Recurring Invoice
- If you haven’t created any customers yet, click the Create New Recurring Invoice to create a new customer.
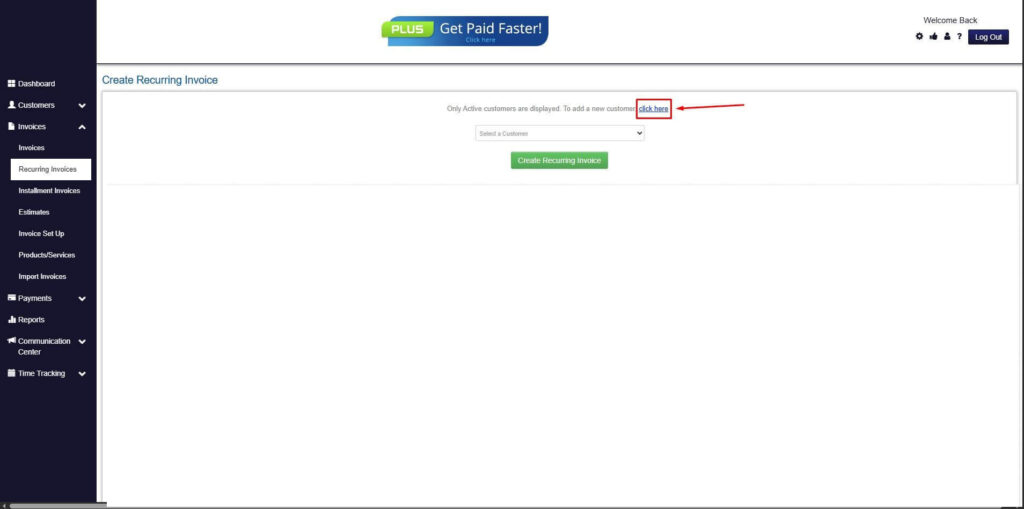
Step 5: Click on the “Click here” Button
- Click on the “Click here” button to proceed with the recurring invoice creation.
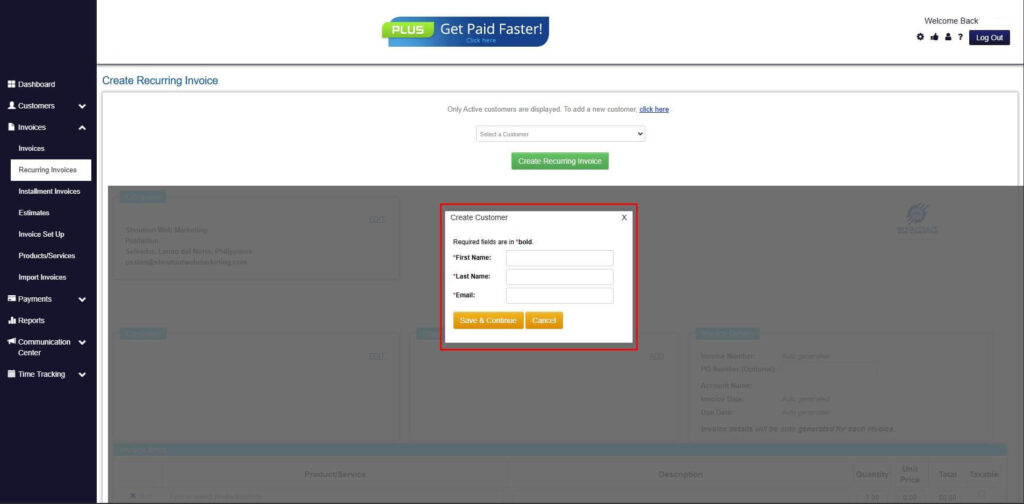
Step 6: Create Customer
- Provide your First Name, Last Name, and Email to proceed.
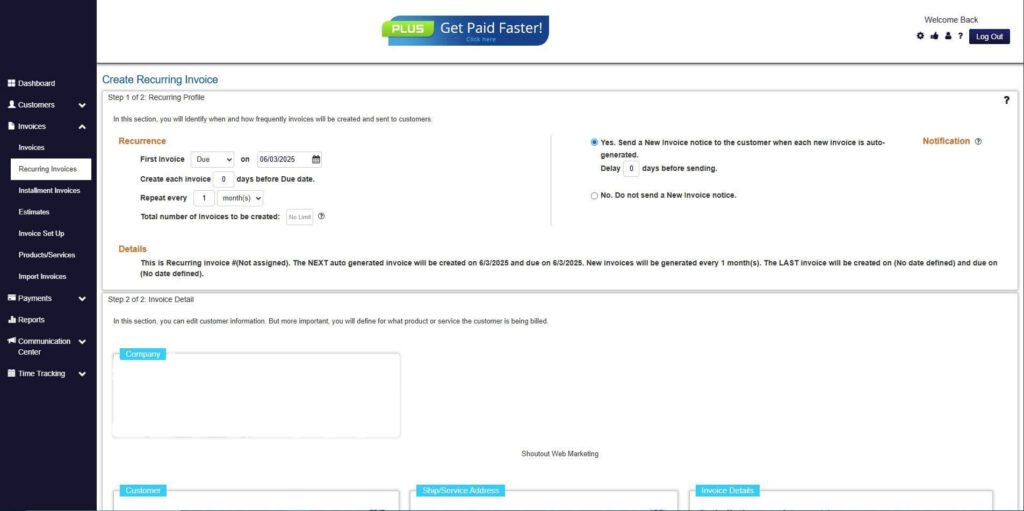
Step 7: Fill in the Create Recurring Invoice Form
- Fill in all the necessary fields.
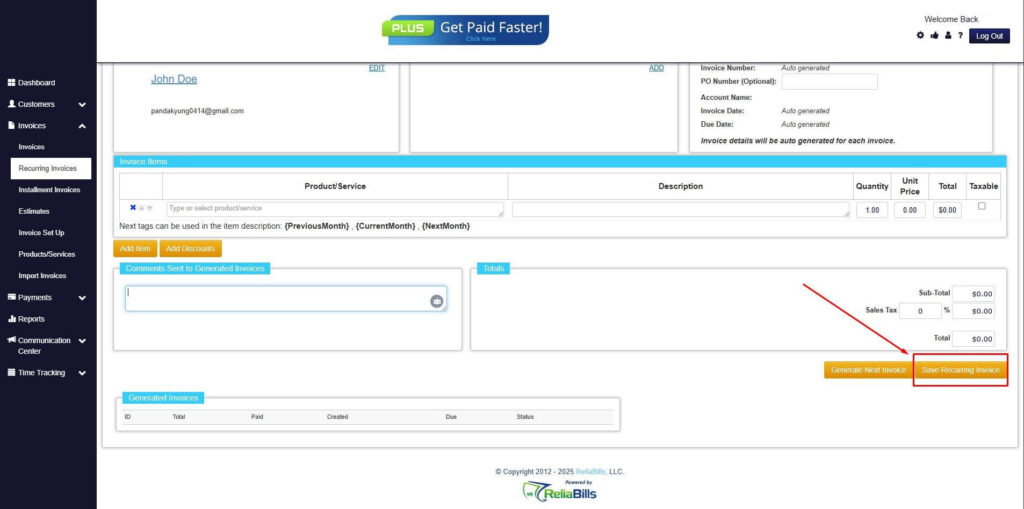
Step 8: Save Recurring Invoice
- After filling up the form, click “Save Recurring Invoice” to continue.
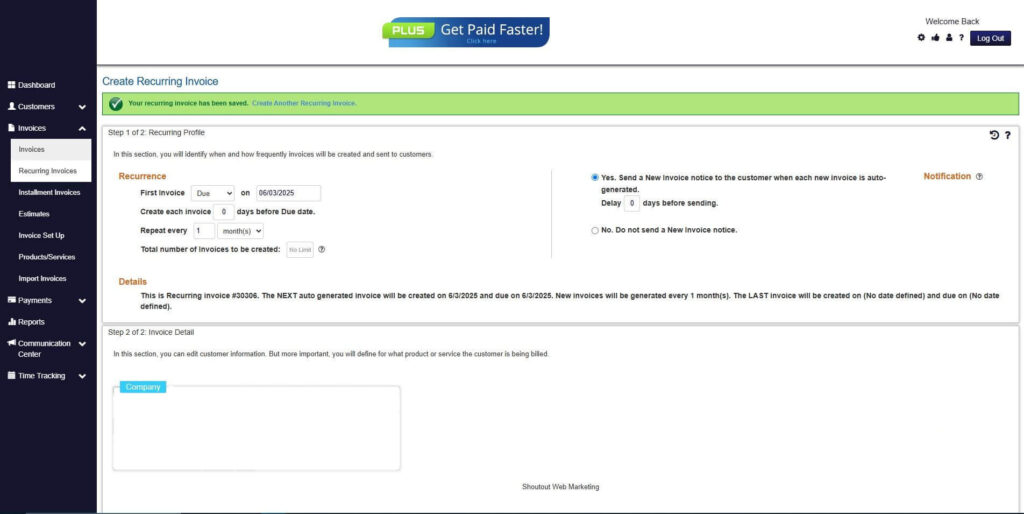
Step 9: Recurring Invoice Created
- Your Recurring Invoice has been created.
Wrapping Up
It’s true that there’s a lot more to churn rate than what meets the eye. It may have a simple definition. But the formulas as to how to calculate it are varied. There isn’t a one-way method of calculating and dealing with your churn rate. That’s why it’s essential to be educated about it. We believe that your churn rate forms a better basis of comparison between different time periods. Ultimately it will give you a better picture of your monthly subscriber churn.