
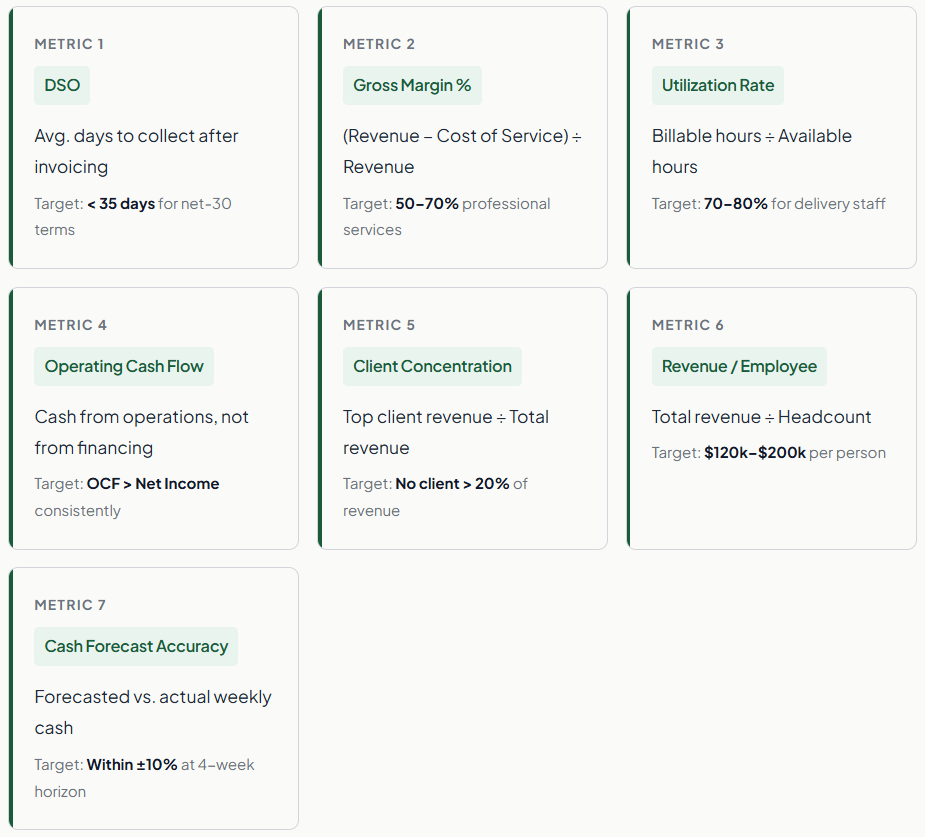
Financial reporting for small businesses in the service sector is not the same as financial reporting for product businesses, and the difference isn’t trivial. Service businesses have almost no inventory, high labor costs that scale directly with revenue, and cash that frequently arrives weeks after the work is done. That combination makes the standard P&L statement an incomplete picture. The metrics that actually move decisions for service owners are DSO, gross margin per service line, utilization rate, operating cash flow, client concentration, revenue per employee, and 13-week cash forecast accuracy. Track those seven consistently and you’ll know more about your business than most owners ever do.
What Is Financial Reporting for Small Businesses?
Financial reporting for small businesses is the practice of systematically measuring, organizing, and reviewing the financial data that reflects a business’s economic performance and using that data to make operating decisions. For most small businesses, it involves three core reports generated on a regular cadence: the profit and loss statement (P&L), the balance sheet, and the cash flow statement. For service businesses specifically, those three reports need to be supplemented by operational metrics that the standard accounting documents don’t capture.
The important distinction is that financial reporting is not bookkeeping, and it’s not tax preparation. Bookkeeping is the data entry, recording transactions, and reconciling accounts. Tax preparation is a compliance exercise. Financial reporting is the analysis layer on top of both: turning accurate records into visibility that enables better decisions. A business can have spotless books and terrible financial reporting if no one is drawing insight from the numbers.
For service businesses managing recurring billing, project-based invoicing, or installment billing, financial reporting also needs to distinguish clearly between cash received and revenue earned, a distinction that doesn’t come up for businesses that deliver and collect at the same time.
The Seven Metrics That Actually Matter for Service Businesses
This section is going to read differently than most financial reporting guides, because most financial reporting guides are written for product businesses. Service businesses, agencies, consultancies, law firms, contractors, coaches, and managed service providers have a fundamentally different financial structure. You’re selling time and expertise, not physical goods. You have no inventory. Your cost of revenue is almost entirely people. Your revenue is often contracted weeks or months before it’s collected.
That structure makes some standard metrics less useful and some non-standard metrics critically important. Here are the seven that actually tell you something:
Why DSO Is the Metric to Pull First Every Monday
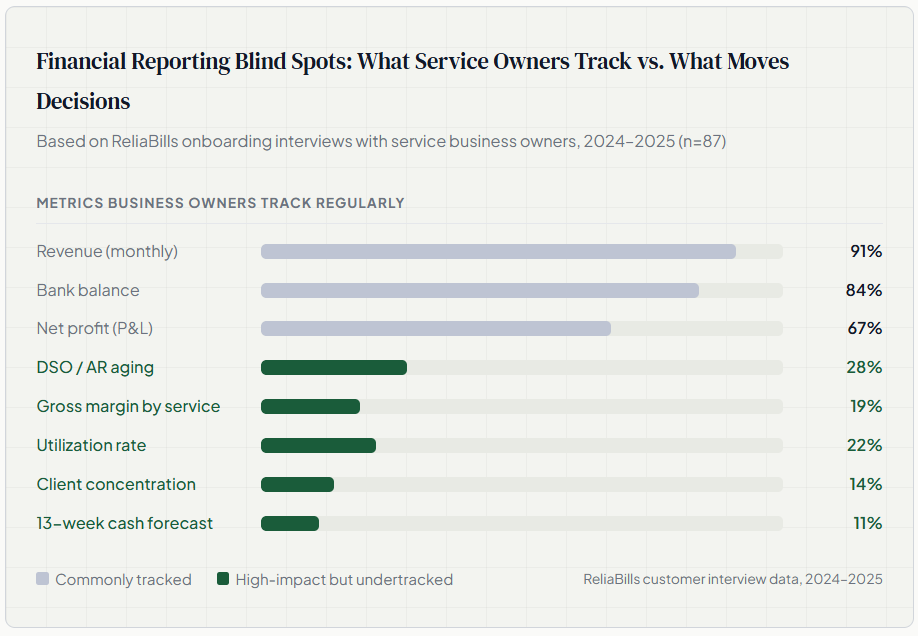
Days Sales Outstanding is the single most useful early-warning indicator for service businesses and the most consistently undertracked. Your P&L shows you what you earned. DSO shows you when you’ll actually see it in your bank account, and whether that gap is growing.
A DSO of 35 days on net-30 terms is fine. A DSO of 55 days on net-30 terms means your clients are paying 25 days late on average. At that point, you’re effectively extending 25 days of free credit to your entire customer base, which is a working capital cost that doesn’t appear anywhere in your P&L. Profitjets’ DSO analysis makes the practical implication clear: when receivables grow faster than cash collected, the gap compounds quietly for months before it creates a cash crisis visible enough to force action.
The cleanest DSO tracking setup for a small service business: run your AR aging report weekly, note the total balance and the percentage over 30 days, and calculate DSO monthly. If DSO is trending up over three consecutive months, your collections workflow needs attention before the trend becomes a crisis.
Gross Margin by Service Line, Not Just Overall
An overall gross margin of 55% looks healthy. But if service line A runs at 70% margin and service line B runs at 30%, the overall number is hiding a decision you should be making: either reprice service line B, restructure its delivery, or stop offering it.
This is the granularity that separates financial reporting from financial awareness. Awareness tells you the business is profitable. Reporting tells you which parts of the business are profitable and which ones are funding your least efficient work. Eagle Rock CFO’s professional services gross margin benchmarks note that utilization rate is the single largest driver of gross margin variation between otherwise similar firms, which means improving utilization from 65% to 75% on a team of five at $150/hour adds approximately $156,000 in annual gross profit with zero additional clients.
The Three Reports Every Service Business Needs on Demand
You can build an elaborate reporting system, but if you can’t generate these three reports within five minutes on any given day, your financial reporting is operationally incomplete. Each serves a different purpose and answers a different question.
The Profit and Loss Statement: “Did We Make Money?”
The P&L answers the earnings question, revenue minus expenses equals net income. For service businesses, the most useful version is a P&L segmented by service line or client type, not just a single totaled report. A consolidated P&L that shows $200,000 in revenue and $160,000 in expenses is less useful than one that shows you which engagements generated that $40,000 margin and which ones eroded it. Generate this monthly. Review it within five business days of month-close.
The Cash Flow Statement: “Where Is the Money?”
The cash flow statement is the report most service business owners know they should read but routinely skip because the P&L feels like enough. It isn’t. You can be profitable on paper, revenue recognized, and and margin intact, while simultaneously running out of operating cash because clients are paying 45 days late and your payroll is due in 10. Ramp’s 2026 analysis of cash flow failures in profitable businesses identifies growing AR as the most frequent culprit. The cash flow statement makes that AR growth visible in financial terms. Review it monthly alongside the P&L, not instead of it.
The AR Aging Report: “Who Owes Us Money and How Old Is It?”
This is the report most service business owners don’t think of as a financial report but should. Your AR aging report is a real-time view of where your billed-but-uncollected revenue is sitting, broken into buckets by how long it’s been outstanding (0–30 days, 31–60, 61–90, 90+). The 90+ bucket is particularly important: receivables in that range have historically lower collection rates and represent a real write-off risk. If the dollar value in your 90+ bucket is growing month over month, your collections workflow isn’t working. Pull this weekly.
The Reporting Cadence That Works for Service Owners
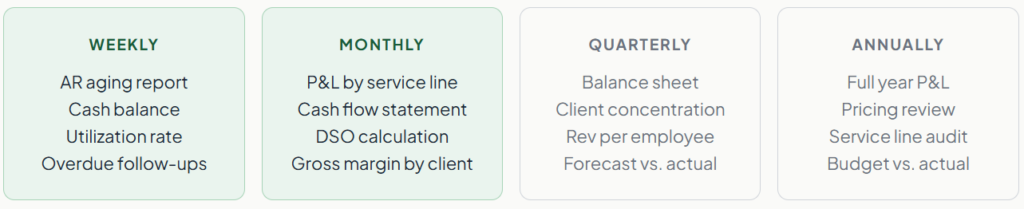
The cadence matters as much as the reports themselves. Reviewing financials annually tells you what happened. Reviewing them on the right cadence tells you what’s happening while you can still do something about it.
Real-World Use Cases by Service Business Type
Marketing and Creative Agencies
For agencies, the financial reporting challenge is that project revenue often lands unevenly, a large retainer payment in month one, then steady billing through the contract term, then a gap before the next engagement closes. That lumpiness makes the monthly P&L an unreliable guide to business health on its own. The metrics that matter more for agencies are DSO (because late-paying clients are common), utilization rate (because unbillable time on an agency team is invisible but expensive), and client concentration (because the classic agency failure mode is one whale client that represents 40% of revenue and then exits). Building a reporting habit around those three, reviewed weekly, gives you meaningful visibility that the monthly P&L doesn’t.
IT and Managed Services Providers (MSPs)
MSPs are a useful case study because they typically run two billing models simultaneously: recurring monthly managed service fees (flat-rate retainers) and project billing for implementation or remediation work. The recurring component is predictable and models well in a cash forecast. The project component is lumpy and variable. Financial reporting for an MSP that doesn’t separate these two revenue streams is aggregating two fundamentally different cash flow patterns into a single number, which makes both harder to manage. Segment your P&L and your AR aging by billing type, and you’ll immediately see which part of your business needs attention. For the recurring component specifically, an integrated view of your recurring billing and your AR aging should be part of your weekly reporting routine.
Professional Services: Law, Accounting, Consulting
The distinctive financial reporting challenge for professional services is unbilled work, time that’s been delivered to clients but hasn’t been invoiced yet, sometimes called “work in progress” (WIP). WIP is an asset that doesn’t appear in your bank account, doesn’t show up in your AR aging report, and creates a systematic understatement of how much revenue your business has actually generated. Firms that don’t track WIP consistently make pricing and capacity decisions based on incomplete information. A monthly WIP review, showing how much we have delivered this month that we haven’t yet invoiced, should be standard practice for any professional services firm billing on time and materials.
Key Benefits of Systematic Financial Reporting
The case for structured financial reporting is not that it makes you a better accountant. It’s that it changes the speed and quality of decisions.
You see problems early enough to do something about them.
A DSO that increases from 32 to 41 days over three months is a signal that’s visible if you’re tracking it weekly. A cash shortfall discovered on Friday when payroll is Monday is not a problem with an easy solution. The same underlying issue, slow-paying clients, produces very different outcomes depending on when you see it.
You price based on data, not intuition.
Most service businesses’ underpricing isn’t malicious; it’s a function of not knowing your actual cost of delivery. When you track gross margin by service line, you know exactly which services have the room to absorb a competitive discount and which ones are already at the margin floor. That’s pricing intelligence that doesn’t come from a hunch.
You make hiring decisions with more confidence.
The question “can we afford to hire?” is almost never answerable from a bank balance alone. It requires knowing your projected cash position three to six months out, your current utilization rate (which tells you whether you have a capacity problem that hiring would solve), and your revenue per employee trajectory. That information comes from consistent financial reporting, not from a single review of this month’s numbers.
It strengthens your position with lenders and investors.
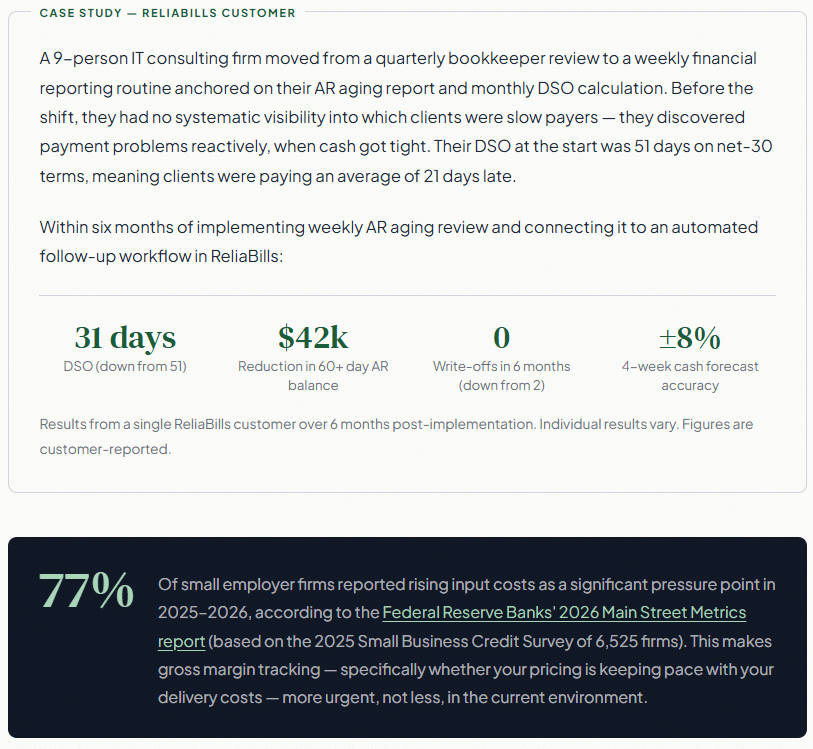
The Federal Reserve’s 2026 Main Street Metrics found that credit access remains a persistent challenge for small employer firms. Businesses with organized, consistent financial reporting, not just clean books but also a clear reporting routine, demonstrate creditworthiness in a way that lenders respond to. A business owner who can produce their DSO trend, gross margin by service line, and a 13-week cash forecast in an hour is a categorically different credit risk than one who can only produce last year’s tax return.
What to Watch For: Reporting Gaps That Create Real Harm
Bad financial reporting doesn’t just leave you uninformed, it actively misdirects decision-making.
Confusing profit with cash.
This is the financial reporting mistake that most commonly blindsides profitable businesses. A business running $50,000 per month in net income can still miss payroll if clients are paying net-60 and overhead is due net-15. The P&L says you made $50,000. The cash flow statement says $62,000 is sitting in receivables and $38,000 came in. Those are different numbers with different implications. Reviewing both monthly, not just the P&L, is the minimum standard for financial reporting that actually protects you.
Reporting lag that makes numbers historical rather than operational.
If your monthly P&L is ready on the 25th of the following month, that’s financial archaeology, not financial reporting. By the time you see a March margin problem in late April, you’ve already made April’s staffing and expense decisions without the information. Tightening your month-close process and having clean books by the 5th and P&L by the 8th converts your financial reporting from historical documentation into an operating tool.
Aggregate reporting that hides client or service-line problems.
A single blended margin number can show a healthy 52% while hiding a service line running at 28% and another at 71%. A single DSO number can look reasonable while a handful of slow-paying clients skew the average and account for 80% of your 60-day+ AR balance. The financial reporting habits that serve a 3-person firm don’t automatically scale to a 12-person firm. As you add clients and service lines, the aggregate reports become less and less useful as decision-making tools.
Financial Reports Compared: What Each One Tells You
| Report / Metric | Question it answers | Frequency | Specific to service businesses? |
|---|---|---|---|
| Profit & Loss (P&L) | Did we make money this period? | Monthly | ⚡ Partial, needs service-line segmentation |
| Cash Flow Statement | Where did cash come from and go? | Monthly | ✓ Critical, catches profit/cash gap |
| Balance Sheet | What do we own vs. owe at this moment? | Quarterly | ✗ Less distinctive, minimal inventory for services |
| AR Aging Report | Who owes us money and how old is the debt? | Weekly | ✓ Highest-priority operational report for services |
| DSO Calculation | How long does it take us to get paid? | Monthly | ✓ Primary cash flow early-warning metric |
| Utilization Report | What percentage of capacity is billable? | Weekly | ✓ Service-specific, irrelevant for product businesses |
| 13-Week Cash Forecast | What will cash look like over the next quarter? | Weekly (updated) | ✓ Essential for managing project-revenue lumpiness |
| Client Concentration Report | How dependent are we on any single client? | Quarterly | ✓ Service-specific risk not visible in standard reports |
What I Got Wrong at First: Common Reporting Mistakes
Mistake 1: Treating the P&L as the only financial report that matters
When a profitable business reports a cash crisis, the owner almost always had a clean P&L right up until the point the crisis hit. The P&L showed healthy margins. What it didn’t show was that receivables had been quietly growing for four months, clients paying slower, AR aging upward, while expenses ran on schedule. The cash flow statement and the AR aging report would have shown this. The owner wasn’t looking at either one.
✓ Fix: Make the cash flow statement and the AR aging report equally non-negotiable alongside the P&L. If you’re only comfortable reviewing one of the three, start with a 30-minute education session with your accountant on how the other two work. The investment pays off the first time you catch a collections problem before it becomes a payroll problem.
Mistake 2: Looking at blended revenue without any service-line breakdown
A marketing consultant running three service lines, brand strategy, content production, and paid media management, had a blended gross margin of 54% and felt like the business was in good shape. When we broke it down by service line, brand strategy was running at 72% margin, content production at 61%, and paid media at 29%. The paid media work was subsidized by the other two lines, but nobody had seen that because no one had ever segmented the P&L. The 29% margin line was also the one consuming the most team hours. They repriced it, raised rates 40%, and lost two of four clients. Margin went to 52% on that line. Overall business margin went up, not down.
✓ Fix: Segment your P&L by service type or client type from day one, even if it feels like extra work. The aggregate number is context; the segmented numbers are actionable information.
Mistake 3: Waiting for accounting to close before reviewing DSO
DSO is a metric you should be able to calculate at any point in the month from your billing system’s data, not a metric that requires waiting for month-close. If your DSO review depends on your accountant closing the books, you’re reviewing data that’s 30–45 days old. In a service business where cash timing is critical, that lag is too long. The AR aging report in your invoicing software or billing platform is updated in real time. That’s the DSO source you should be pulling weekly.
✓ Fix: Build your weekly DSO check from your billing platform’s AR aging view, not from accounting reports. For service businesses using ReliaBills, the AR aging dashboard updates with each payment received and each invoice issued, which means you can pull a current DSO estimate any day of the week without waiting on anyone.
Mistake 4: Ignoring client concentration until a client leaves
This is the mistake that produces the most dramatic outcomes. A service business where one client represents 35% of revenue isn’t just highly concentrated, it has a material business risk that exists entirely outside its financial statements. The P&L looks fine. The cash flow looks fine. The DSO looks fine. And then the client exits, and quarterly revenue drops 35% in a single cycle. A quarterly client concentration review, a simple calculation, in five minutes, would have put that risk on the table before it became a crisis and allowed intentional diversification.
✓ Fix: Add client concentration to your quarterly reporting routine as a standard calculation. If any single client exceeds 20% of trailing 12-month revenue, flag it as an active risk. The goal isn’t to fire the client, it’s to make sure you’re building the pipeline actively enough to dilute the concentration over time.
How to Get Started with Better Financial Reporting
The setup doesn’t require a CFO or a financial software overhaul. It requires a decision about what you’re going to look at, how often, and what you’re going to do when the numbers are telling you something.
Step 1: Get your books current and closed within 8 business days of month-end
Everything else in financial reporting depends on accurate, timely books. If your bookkeeper is delivering a March P&L in early May, your financial reporting is permanently historical. Compress your month-close cycle. Establish a hard deadline with your bookkeeper. If you’re doing your own bookkeeping, build the reconciliation and close as a scheduled task in the first week of each month, not something you do when you get around to it.
Step 2: Set up your weekly AR aging pull
Your billing platform or invoicing software generates an AR aging report. If it doesn’t, you need different software. Block 20 minutes every Monday to pull the report, note the total open balance, the amount in the 31–60 and 60+ buckets, and any specific accounts that have moved into a higher aging category since the prior week. This takes less time than checking email and tells you more about your business.
Step 3: Build a monthly DSO calculation
On the first of each month, calculate last month’s DSO: (Accounts Receivable ÷ Annual Revenue) × 365. Track it in a simple spreadsheet. Three data points make a trend; six months of DSO data is a genuinely useful operational view of how your collections performance is evolving.
Step 4: Segment your P&L at month-close
In your accounting software, create service line classes or categories and assign revenue and direct delivery costs to each. Most platforms, QuickBooks, Xero, FreshBooks, support this natively. The first segmented P&L you run will likely show you something you didn’t know about your own business. The ongoing segmented view will tell you which service lines deserve more investment and which ones are quietly inefficient.
Frequently Asked Questions
1. What financial reports does a small service business actually need?
Three reports are non-negotiable: the profit and loss statement (monthly, segmented by service line), the cash flow statement (monthly), and the AR aging report (weekly). Beyond those three, a DSO calculation (monthly), a 13-week cash forecast (updated weekly), and a quarterly client concentration review give you the visibility that matters most for service business decisions. The balance sheet is important but less operationally urgent, review it quarterly and before any financing discussions.
2. How is financial reporting for a service business different from a product business?
Three structural differences change what matters most: service businesses have no inventory (so balance sheet inventory analysis is irrelevant), their cost of revenue is primarily labor (making utilization rate a critical lever that product businesses don’t have), and they frequently deliver work before collecting payment (making DSO and AR aging more operationally critical than for businesses with point-of-sale cash collection). A product business P&L is organized around cost of goods sold, inventory turns, and product margin. A service business P&L should be organized around utilization, gross margin per service line, and revenue per delivery hour.
3. What is a good DSO for a service business?
DSO is best evaluated relative to your payment terms. If your standard terms are net-30, a DSO of 33–38 days is healthy, some clients pay early, some pay a few days late, and the average lands near your terms. A DSO of 45+ days on net-30 terms signals systematic late payment across your client base. A DSO above 60 days on net-30 terms indicates a collections process problem that needs immediate attention, that level of delay translates to two months of revenue sitting uncollected at any given time. The trend matters as much as the absolute number: a DSO rising from 35 to 42 over three months is a more urgent signal than a stable DSO of 42.
4. How do I track financial metrics without a full-time accountant or CFO?
The weekly metrics, AR aging, utilization rate, and cash balance, come directly from your billing platform and project management tool, not from your accountant. They require no accounting expertise to pull. The monthly metrics, P&L, DSO, and gross margin by service line require clean books, which is where your bookkeeper’s work connects to your reporting. A bookkeeper plus a monthly 60-minute financial review with yourself (or a quarterly session with a fractional line fulfills the reporting needs of most service businesses under $2M in revenue. The investment in a fractional CFO engagement, typically $1,500–$3,500 per month, usually pays back in better pricing decisions and fewer cash surprises within two quarters.
5. My P&L looks profitable, but I’m always tight on cash. What’s happening?
This is the most common financial reporting blind spot for service businesses. Profit and cash are measured differently: profit is recognized when revenue is earned (accrual accounting), and cash is tracked when it actually arrives in your account. If you invoice clients net-30 and they pay in 45–60 days, you’re recognizing revenue that isn’t cash yet. Your P&L shows the margin; your bank account shows the delay. The immediate diagnostic: pull your AR aging report and look at the total open receivables balance. If that number is large relative to your monthly revenue, your cash is sitting in unpaid invoices. The fix is tightening your collections process, automated reminders, proactive follow-up at 7 days past due, and a dunning sequence that reduces how long it takes clients to pay.
6. How does billing automation improve financial reporting?
Billing automation improves financial reporting in two ways: data quality and timeliness. When invoices are generated automatically, every charge is recorded consistently, dated correctly, and linked to the right client record, eliminating the data entry errors that make AR aging reports unreliable. When payments are matched automatically, your cash position is current in real time rather than catching up to manual entries. The result is that the reports your financial reporting depends on, AR aging, DSO calculation, and monthly cash position are accurate and current without anyone having to manually update them. For businesses that run recurring billing or installment plans, this is particularly valuable: the billing platform tracks every scheduled charge and payment against the original contract, giving you a complete financial picture of each client relationship without manual reconciliation.
Recent Articles:
- How to Simplify Your Business Invoicing Process: A Step-by-Step Guide
- What Is Collection Automation? How to Get Paid Without Chasing Clients

Brant Pallazza is the Founder and President of ReliaBills, an invoicing and recurring billing platform built to help small businesses secure predictable cash flow. With over 20 years of experience in direct response marketing and e-commerce leadership, including a 13-year tenure managing over $500 million in gross sales at Digital River. Brant writes actionable guides on automated billing, payment processing, and scaling SMBs.